
This week Craig reviews FY-26:
- A narrow return in a complicated year
- ASX300: a tale of three periods
- A signpost to stagflation?
- International markets & AI
- What about FY-27?
And, by the way, First Samuel Australian Shares’ sub-portfolios again outperformed both ASX300 and the median manager.
Copyright 2026 First Samuel Limited
Read the previous Investment Matters here:
The market
FY26: a ‘narrow’ return in a complicated year
This week’s Investment Matters is deliberately contemplative
At first glance, FY26 looks like a perfectly acceptable year for Australian equities.
The ASX 300 delivered a total return of 6.1% including dividends. Our clients did slightly better than this. But as so often happens in markets, the headline number tells only a small part of the story.
What mattered in FY26 was not just the return, but how it was generated. By year-end, almost all of the market’s gain had come from the largest 20 stocks – the 20 Leaders or ASX20. The remainder of the ASX 300 was essentially flat, returning only 0.5%. In other words, the market return was narrow, concentrated and, in many respects, misleading.
The AFR’s columnist Chanticleer was even starker in his assessment: “If you add the index points from five winners and deduct the five losers, you get pretty close to the entire benchmark’s 236.43-point gain for the financial year. The other 190 stocks net themselves out.”
Within this environment, we were not surprised that active managers tended to return very low single-digit returns. Outperforming this year needed very strong stock selection. Staying in the largest companies appears to have been rewarded but given the size of passive flows and APRA-mandated index hugging, many are now questioning if the demand for these 20 stocks actually reflects the companies and their prospects.
This was not a year in which the Australian market broadly reflected economic strength, business momentum or widespread confidence. It was a year in which investors repeatedly retreated toward size, liquidity and a small number of thematic exposures.
As regular readers would know, we are not investors who follow companies simply because they are large, popular, or the largest stocks in the market. Strong cash flow yield, good value and great assets are not necessarily the hallmarks of the largest companies in either the US or Australian markets in July 2026.
The chart below captures the year well. FY26 can be understood in three periods.
Figure #1: FY26 – a year in three stages
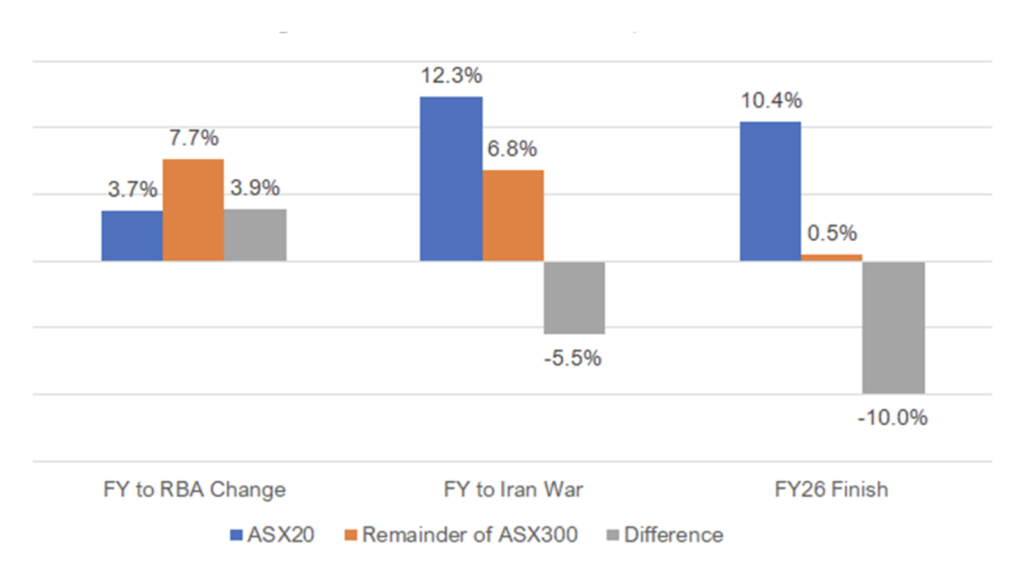
Source: IRESS, First Samuel
Stage 1: Early FY26: optimism and broad participation
The first period ran from the beginning of the financial year through to the point where the RBA changed tack.
This was, in many respects, the healthiest part of the year. Optimism was still present. The broader market was participating. The remainder of the ASX 300 returned 7.7%, comfortably ahead of the ASX20’s 3.7%. The difference — around 3.9% — tells the story clearly: this was a period in which investors were willing to move beyond the largest, most crowded names.
This mattered because many of the biggest stocks — especially the banks — were already expensive. At the same time, a wide range of smaller and mid-sized companies had already endured a long period of valuation compression. Early in FY26, investors were still prepared to believe that inflation was gradually coming under control, that interest rates would eventually ease, and that opportunities beyond the index heavyweights could perform strongly.
For a while, that is exactly what happened. Breadth improved. Gold stocks began their surge, which would last till January. Smaller companies outperformed. The market felt more balanced. But it did not last.
Stage 2: The RBA changes tack: uncertainty returns, and money hides in the ASX20
The second phase began when the RBA changed the market’s understanding of the economic path ahead. The Cup Day meeting became a key turning point. The hawkish tone of the Cup Day meeting shifted standard market expectations. Whether or not one focuses on that meeting alone, or the RBA cash rate rise that followed, the larger point is that the market was forced to confront a different reality: inflation remained difficult, policy was restrictive, and Australia’s economy was more fragile than many had hoped.
Housing affordability returned as a political and economic issue again as the outlook for interest rate relief turned into even higher mortgage payments by year-end.

As that realisation spread, risk appetite deteriorated. Global investors and large domestic institutions — especially those increasingly focused on benchmark awareness — moved back toward the biggest stocks. The market herded toward the ASX20, seeking liquidity, familiarity and perceived safety.
By the period immediately before the Iran war, the ASX20 had returned 12.3%, while the remainder of the ASX300 had returned 6.8%. That is a reversal of 5.5% in favour of the largest companies.
This was a major shift in market character.
The broad optimism of the first phase gave way to a more defensive mindset. The more complicated the investment story, the less appetite the market had for it. Smaller companies sold off. Businesses exposed to domestic weakness became harder to own. Higher rates hurt both confidence and valuation support. The February company reporting season highlighted pressure in a range of companies.
The chart below shows how the returns by sector evolved through FY26. Note the slide begins at the start of November, coinciding with the RBA meeting.
Figure #2: Total return by sector (%) – evolution through FY26
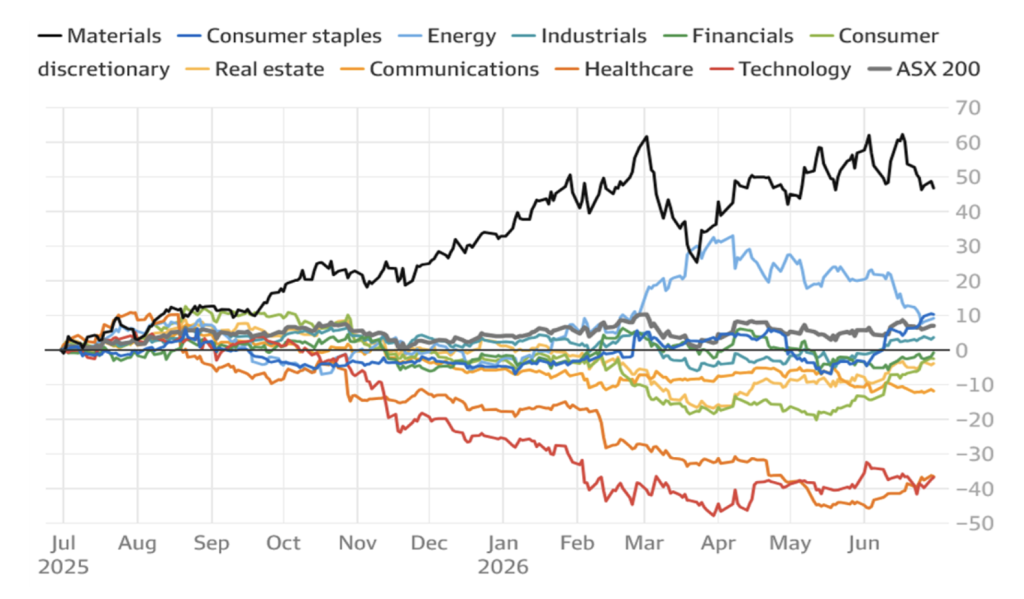
Source: AFR, LSEG
At the same time, another force was beginning to matter more: the early impact of the AI investment boom. Australia has very little direct exposure to artificial intelligence compared with the United States. Companies such as Goodman Group and NextDC had already proven expensive and disappointing. The ASX did not have the obvious winners. But what we do have are some second-order and often obscure proxies: bulk materials, power, grid investment, copper, engineering capacity and the physical inputs required to support a more energy-intensive digital economy.
Figure 2 above shows the Materials (mining) sector continued to power ahead – the black line that finished strongest.
That theme began to support parts of the market, even before the geopolitical shock that followed.
Stage 2: Iran war: the final straw, and only AI proxies hold up
The third phase of FY26 was shaped by the war in Iran.
By that point, confidence was already fragile. Smaller companies had sold off. The domestic economy was weakening. Household pressures were rising. Markets were already narrowing. The war did not create these stresses, but it was the final straw for risk appetite.
After that, investors became even more selective. The market had little interest in broad cyclical optimism, turnaround stories or businesses exposed to a struggling Australian consumer. Instead, money gravitated toward a small number of companies with global relevance or thematic support.
AI proxies
That was where the so-called AI proxies became important. In the Australian context, this often meant BHP and Rio Tinto, even though neither is a pure AI investment. They are simply large enough, liquid enough, and globally recognised enough to absorb flows when investors want exposure to commodity intensity, infrastructure build-out, and “picks and shovels” demand. BHP and RIO both rose more than 50% for the year despite iron ore weakening through FY26.
We were pleased to own more than our fair share of this materials and mining theme, but by year-end, the result was stark.
The ASX20 finished FY26 up 10.4%, while the remainder of the ASX300 was up just 0.5%. The gap was 10.0%. That is the real story of the year. The Australian market did not deliver a strong, broad-based return. It delivered a narrow return dominated by the largest companies, while much of the market went nowhere.
Signpost to stagflation?
The narrowing of ASX returns was not happening in isolation. Behind the market, the domestic economy was weakening. That is one of the reasons we have been spending time thinking about the idea of a modern Australian stagflation trend.
We do not mean 1970s-style stagflation. But we do mean an environment where inflation remains too sticky, growth is less productive than it appears, and households are increasingly under strain.
This week, Jarden (a Trans-Tasman investment bank) and its banking analyst, Matthew Wilson, released an interesting update that caught our attention. The latest Australian Energy Regulator (AER) retail performance data shows rising pressure on energy affordability. More electricity and gas customers are carrying debt. More are entering hardship programs. More are relying on payment plans. The end of energy rebates has exposed how fragile many household budgets have become. What concerns us the most is that this only includes the March quarter, and we suspect conditions have deteriorated since then.
Figure 3: Australian Energy Regulator: Quarterly % of households in hardship
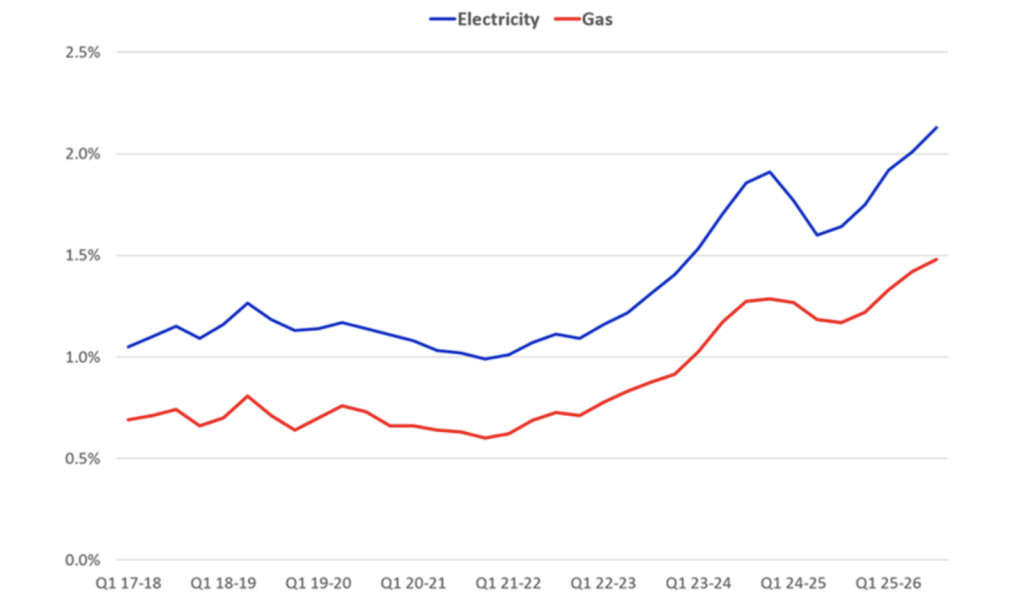
Source: Jarden Research, Australian Energy Regulator
We are interested in this data as a precursor to the banking sector bad debt. This does not translate one-for-one into bank loan losses, but it is a meaningful leading indicator. It tells us that many households are struggling under the combined weight of higher interest rates, energy costs and general cost-of-living pressure.

That is one reason we remain cautious about the domestic economy. That is one reason we remain cautious about the domestic economy.
Australia’s challenge is not simply one of cyclical weakness. It is also structural. Per capita outcomes remain soft, yet inflation continues to run above expectations. Population growth, government spending, and the provision of necessary services drive economic activity, but not always in ways that improve productivity or living standards. That tension is important for investors.
It helps explain why many businesses tied closely to the domestic economy remain vulnerable, why consumers are under strain, and why the market repeatedly sought shelter in a narrower group of stocks.
International markets told a very different story
Another important feature of FY26 was just how much stronger international markets were.
For many clients, overall outcomes were materially improved by international exposure. South Korea was exceptional. Japan performed strongly. Markets outside the US and China also did well. In a year when the Australian market struggled for breadth, offshore markets provided both return and diversification.
Clients benefited from our exposure to emerging markets (+54%), including South Korea, the AI-driven star of international markets, as shown in Figure 4 below. Other overweight positions in Japan also contributed to strong relative performance in clients’ international portfolios.
Figure 4: Sharemarket performance — South Korea, Japan, US, UK, Europe, Australia
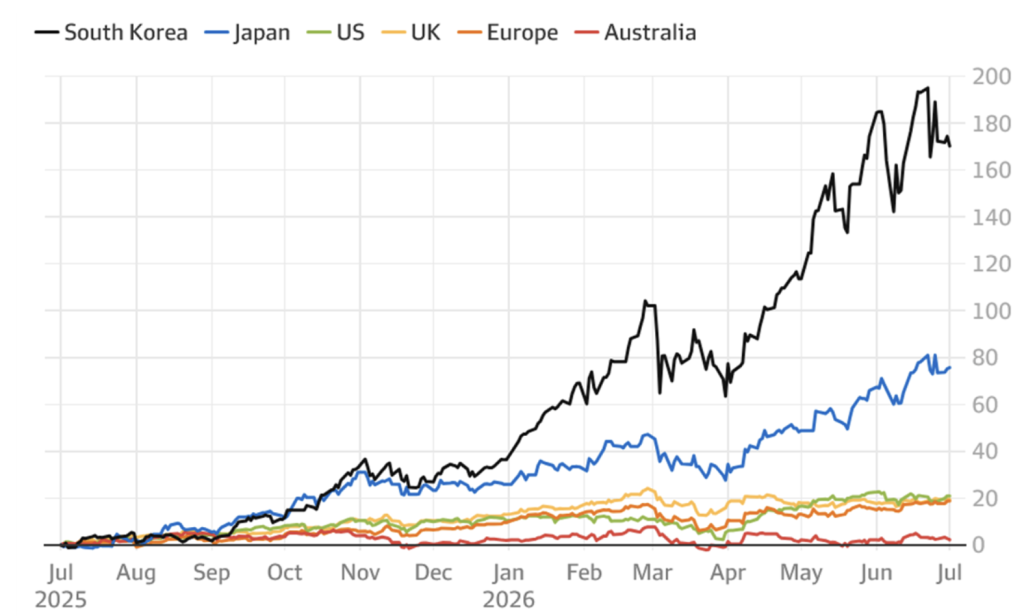
Source: AFR, Bloomberg
The scope of the divergence between countries in FY26 is important insofar as it provides insights into areas such as the US, which are likely both too expensive and too concentrated, based on historical precedent.
Some of the divergence will undoubtedly disappear as AI hype reverses. But the Australian market should not be mistaken for the world. It remains narrow, concentrated, and limited in its exposure to many of the structural growth themes that are driving returns internationally. Mining, minerals and energy transition remain the obvious exceptions. Apart from these, we continue to look at individual companies and their outlooks.
Looking forward: opportunities exist, but selectivity matters
So where does that leave us as we enter FY27?
- Caution
It leaves us cautious about drawing too much comfort from the FY26 headline market return. A market that returns 6.1% while most of that return is generated by the Top 20 is not a market signalling broad economic health.
- Wary of concentration
It leaves us wary of index concentration. The largest companies in the market can continue to perform, but flows have become highly concentrated, and some of the support for current index levels appears tied to narrow themes — including AI proxies that are, at times, quite indirect.
- Opportunities still exist
It leaves us confident that opportunities still exist — just not necessarily where the index is telling you to look.
The broad sell-off outside the largest companies, the growing concentration of flows, and the market’s distrust of complexity are all creating opportunities. There are good businesses within the ASX that are being overlooked because they are too small, too cyclical, too out of favour, or simply not large enough to attract passive and global capital.
- High & rising cash levels
That is why we remain less reliant on index concentration and continue to hold high and rising levels of cash. Cash is not a sign that opportunities do not exist. Quite the opposite. It is a sign that we want the flexibility to take advantage of them. In a market where many assets remain expensive and where any sell-off may create better entry points, patience still has value.
Final thought
FY26 was a year when the Australian market looked better from a distance than up close.
The overall return was acceptable, and we were pleased to outperform most managers and the market. The internal picture was far less reassuring. Early optimism gave way to policy uncertainty. Policy uncertainty gave way to concentration. And concentration gave way to a market increasingly supported by the Top 20 and a handful of AI-linked resource proxies.
The opportunity for investors in FY27 will not come from simply owning the index and hoping for the best. It will come from understanding where the market has become too narrow, where domestic pressures are underappreciated, and where future opportunities may emerge if current confidence weakens further.
The information in this article is of a general nature and does not take into consideration your personal objectives, financial situation or needs. Before acting on any of this information, you should consider whether it is appropriate for your personal circumstances and seek personal financial advice.