
Copyright 2026 First Samuel Limited
This week in Investment Matters:
- population growth has lifted GDP, but not living standards
- this is a stagflation risk, not just a weak-growth story
- the budget and Iran make the starting point harder
Read the previous Investment Matters here:
The market
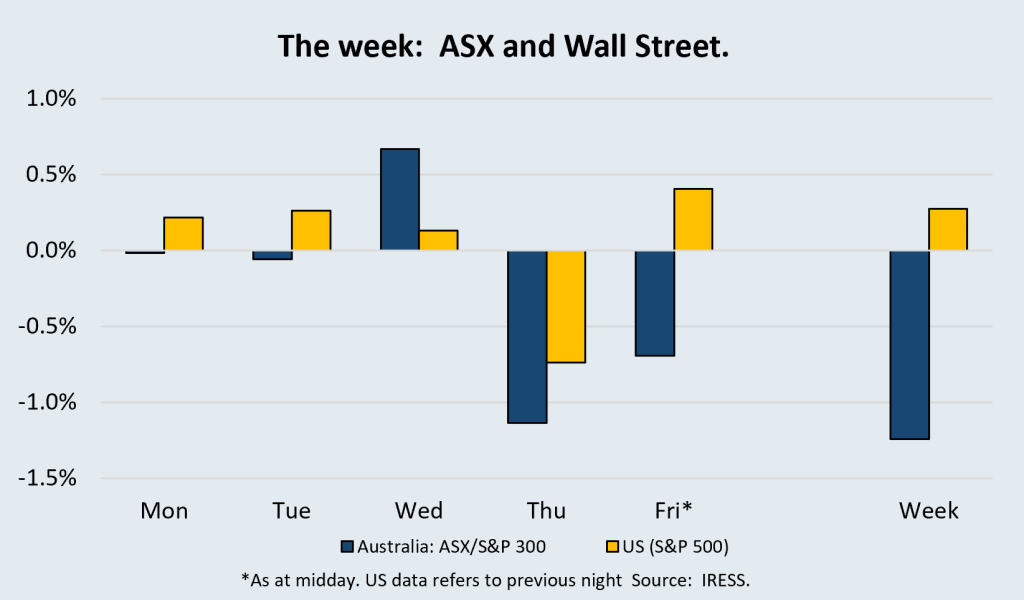
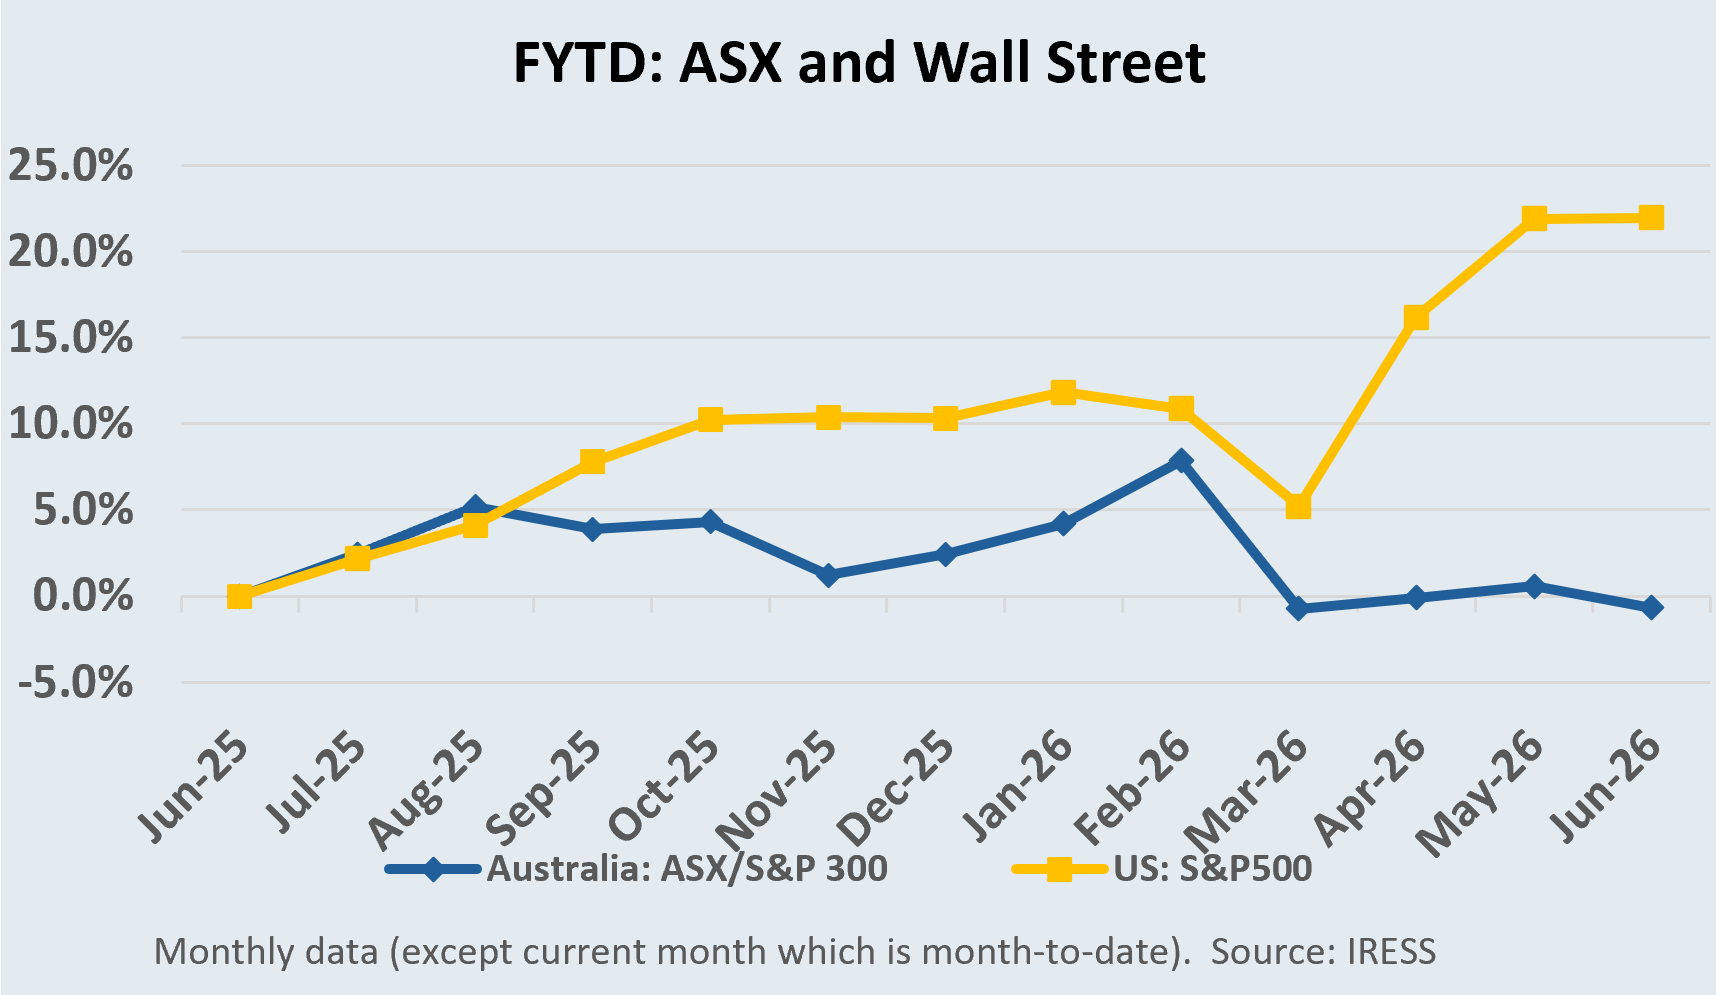
Stagflation concerns are not overstated
The March quarter National Accounts do not show a collapsing economy. They show something more difficult: weak per-capita outcomes, poor productivity, rising pressure on households, and strong domestic demand that is still testing the economy’s capacity. That is why the discussion about stagflation is becoming more relevant.
We would not use the term “stagflation” in a dramatic 1970s sense. Australia is not experiencing a classic wage-price spiral or an oil-shock recession. But it is showing the signs of a modern Australian version of stagflation: aggregate growth that looks acceptable, living standards that are going nowhere, productivity that is weak, household income that is increasingly absorbed by taxes and essential costs, and large investment projects that may add to demand before they add to productive capacity.

This is not simply a complaint about economic policy; your author is good at that, but it adds little value. The point is more practical. Businesses, governments and policymakers are all starting from a difficult position. The economy already has capacity constraints. Households are already stretched. Government spending is already elevated. Population growth has already required a large catch-up in housing, education, health, transport and energy infrastructure. And the data in these National Accounts Q1 numbers largely predates the full impact of the Budget and the later shock from the Iran conflict. Most of the March quarter was unaffected by the Middle East conflict and the higher fuel prices that followed, while April and May survey data already suggested weaker momentum into the June quarter.
The investment implications are straightforward – First Samuel clients:
- are positioned for domestic weakness;
- are dramatically underweight in housing and major banks’ exposure;
- have limited exposure to consumer discretionary; and are wary of services.
There is no indication in the ABS data released this week that we should change course.
GDP: the headline was soft, but the economy underneath was not – risks to interest rates
The headline GDP result was soft. Real GDP rose only 0.3% in the March quarter and 2.5% over the year. In per-capita terms, the result was weaker again: GDP per person fell 0.1% in the quarter and remains below its 2022 peak.
Figure #1: Australian GDP and GDP per capita
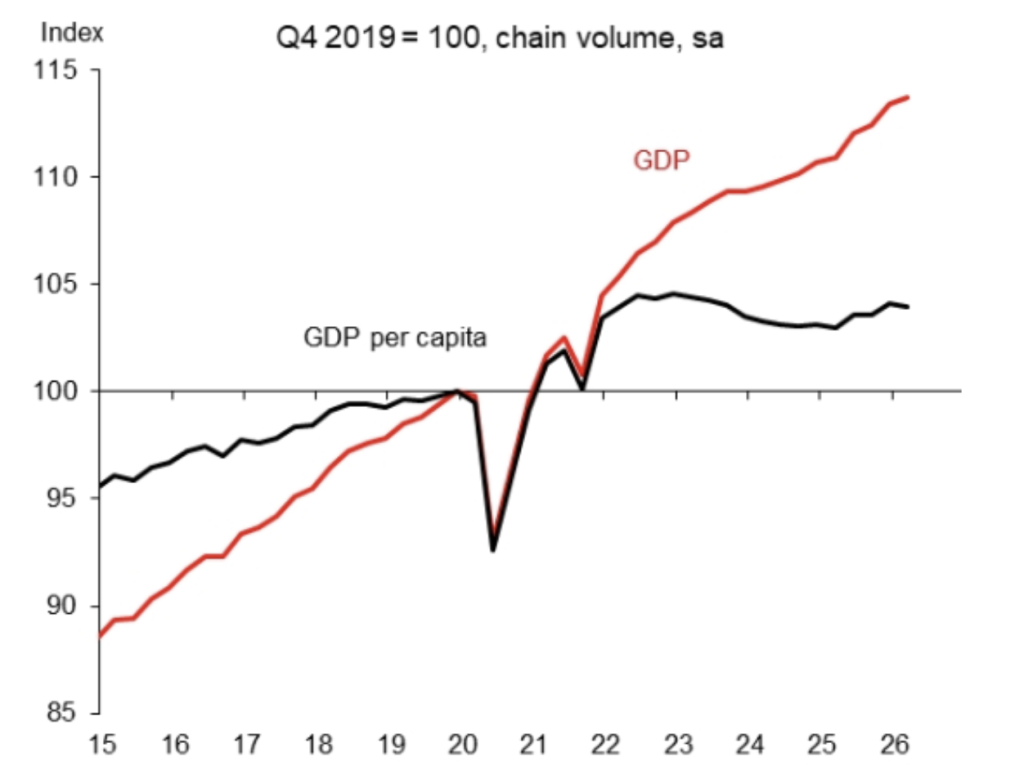
Source: ABS, Macquarie Research
But the soft headline does not mean the domestic economy is weak in the areas that matter for inflation. Final domestic demand rose 1.0% in the quarter and 3.5% over the year. Barrenjoey’s Chart in figure #3 shows domestic demand is both strong and accelerating, which is important here. It shows why a soft GDP print can sit alongside ongoing inflation pressure. The economy is not weak everywhere. It is weak where households feel it, but still strong where capacity is being absorbed.
Figure #2: Domestic demand is both strong and accelerating
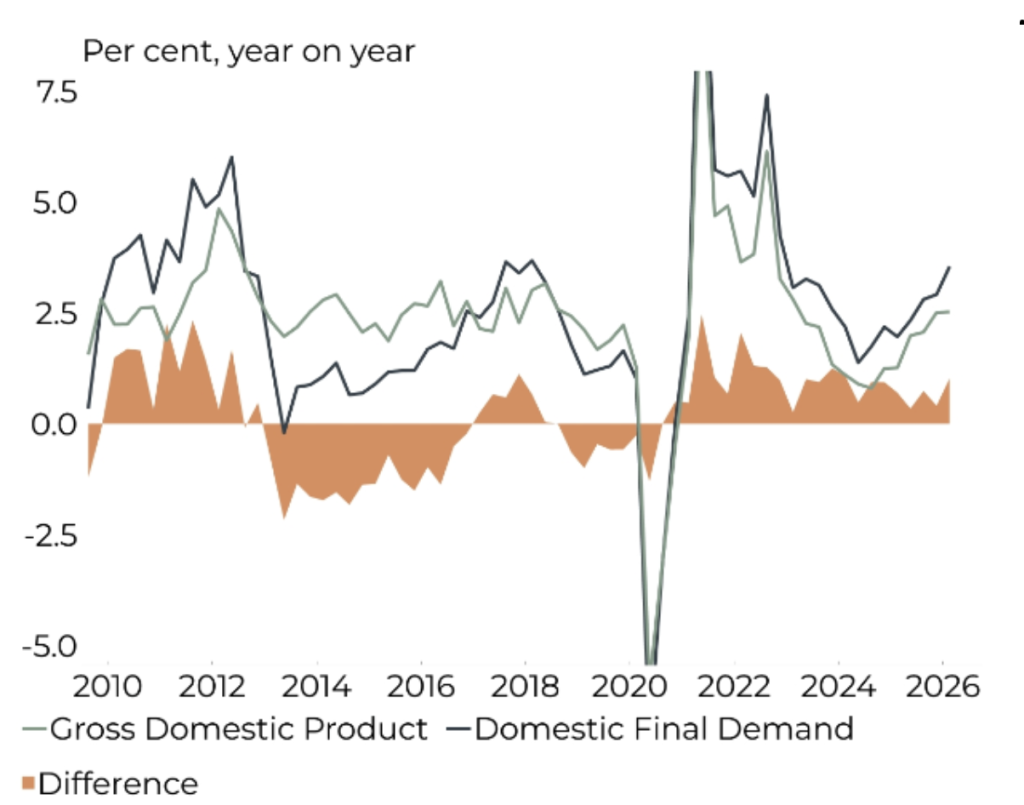
Source: ABS, Macquarie Research
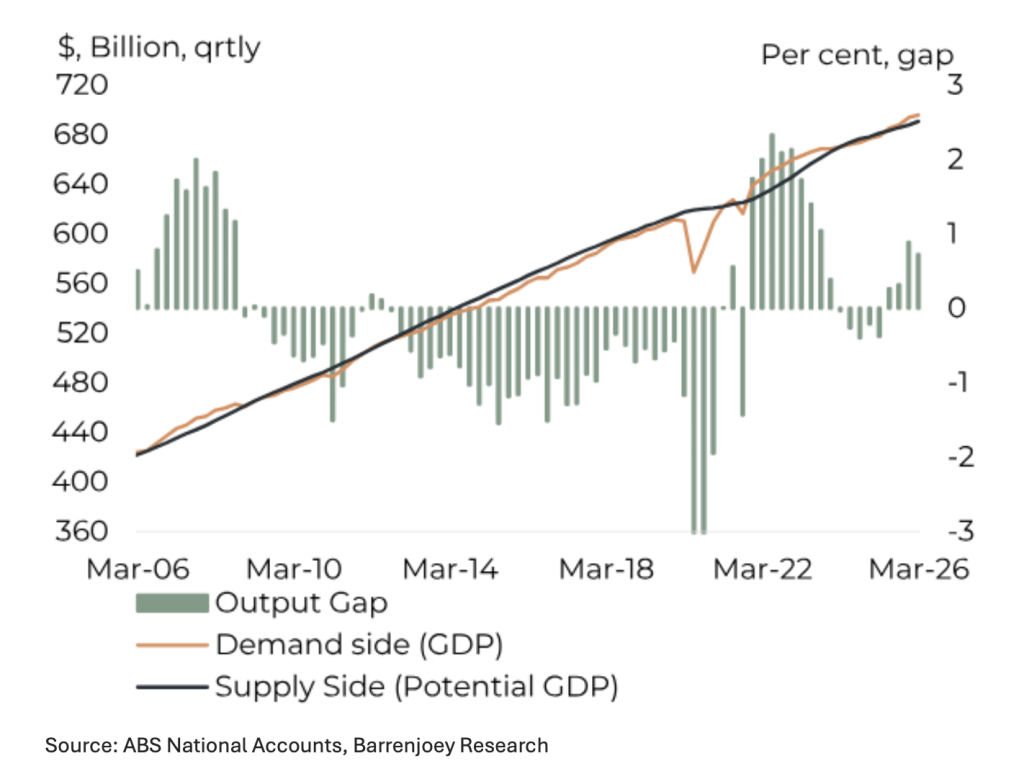
That is the uncomfortable mix. GDP is not growing fast enough to deliver strong per-capita outcomes, but domestic demand is still strong enough to keep pressure on labour, infrastructure, energy, land and government services. This is why the positive output gap matters. A positive output gap means the economy is demanding more than it can sustainably supply. When real output cannot expand quickly enough, the adjustment increasingly comes through prices, taxes, waiting times, lower service quality or weaker living standards.
The chart below shows the positive output gap. The importance of this gap is clear when we recall previous periods of unexpectedly large inflation in 2006/7 and 2021/2 each of which coincided with similar statistics.
Figure #3: Barrenjoey’s estimate of the positive output gap remains steady
Data centres are the bright spot — and the complication
The most obvious bright spot is the data-centre investment boom. Private business investment has surged. Private business investment reached $88bn in real terms, exceeding the peak of the mining investment boom, while machinery and equipment investment rose 16.3% in the quarter, the largest rise in that component in 30 years. Real business investment is at a new record high, comparable to the mining boom. The chart below, from UBS estimates, shows in red that much of the surge in equipment investment was data-centre-related.
Figure #4: Data centres’ contribution to real capex is high and added ~0.8%pts to GDP y/y, but the ‘net’ impact is significantly offset by imports
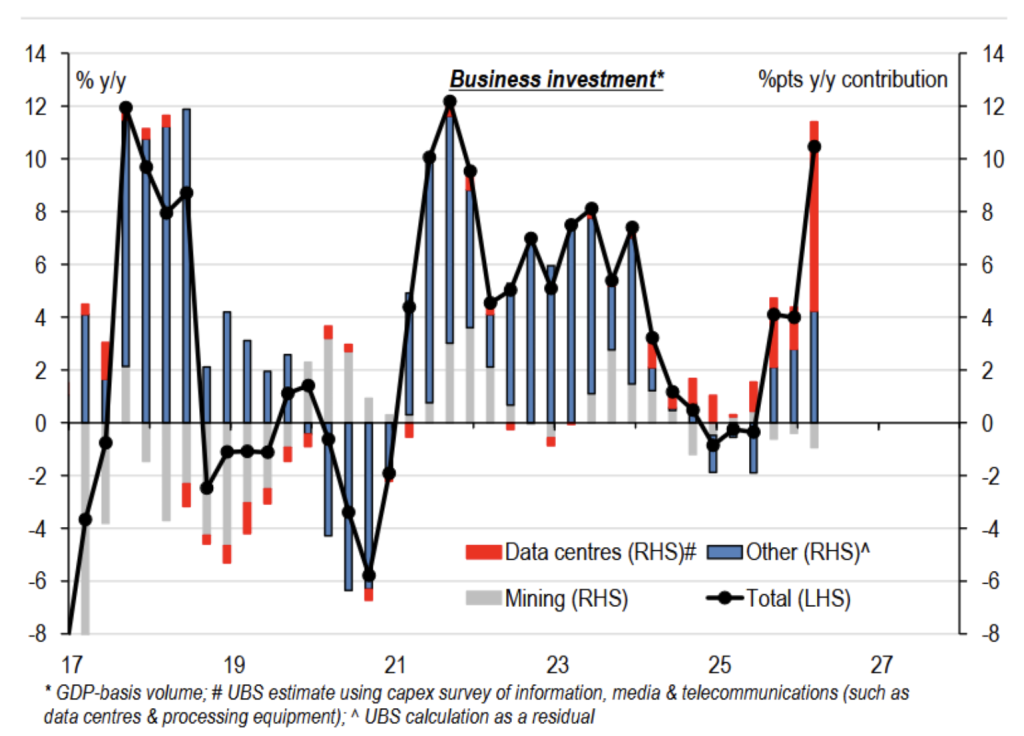
Source: ABS, Macrobond, UBS Research
AI investment booms are not a simple GDP-positive story, like much of the mining investment boom of the late 2000’s. Much of the physical capital is imported. Private final demand picked up largely due to data-centre investment, but much of this investment relies on imported equipment and therefore does not directly add to GDP. We note that machinery and equipment investment rose by 14.7% in the quarter but purchases to equip data centres were largely imported and made only a limited direct contribution to the economy.
In the Figure below, UBS showed the impact in a straightforward manner. The increase in nominal data centre capex was almost exactly offset by the increase in imports of data centre technology-related goods. Whilst not one for one-off project-specific work, the implication is clear. There is lots of activity, but it isn’t necessarily making the nation richer or more productive – yet.
Figure #5- UBS proxy of (nominal) data centre investment (IMT: equipment/fit-out & construction phases) surged recently, alongside a related spike in imports
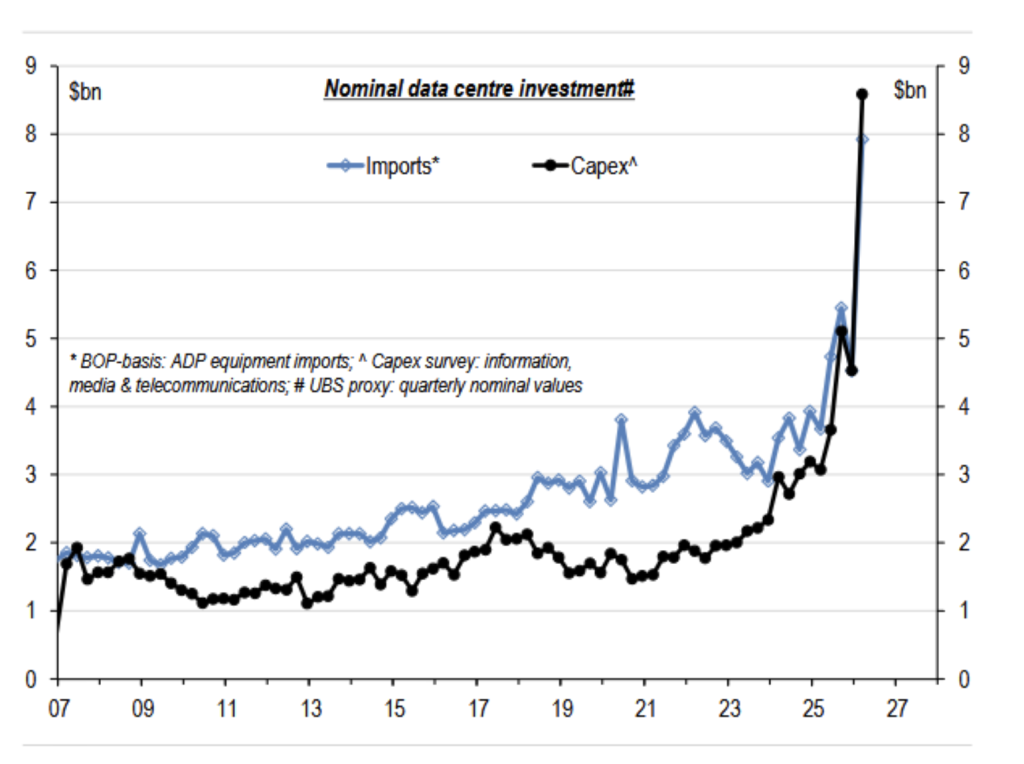
Source: ABS, Macrobond, UBS Research
This is where the data, like the chart above, becomes critical. Led by computing equipment, a range of capital investment measures highlight the most important trends in this National Account release. It visually explains the macro problem.
Australia faces domestic pressure from the data-centre build-out. Construction, grid connections, electricity, water, land, engineers, and capital. But a large share of the expenditure leaks into imports. Barrenjoey also notes that net trade detracted 0.8 percentage points from GDP in the quarter, consistent with the high import intensity of machinery and equipment used in data centres.
We were interested in the AFR Chanticleer article’s framing of the GDP result: “thank goodness for the robots”. The data-centre boom helped keep aggregate GDP positive, and the pipeline appears large. The AFR article also notes the links to energy-transition investment, given the sector’s enormous electricity requirements. Implicit in the AFR tongue-in-cheek response is an understanding that not only do those investing in these expensive assets need a return on investment, but increasingly, the entire economy will rely on the AI investment to kick-start improvements in productivity and growth.
Australia is now approaching almost a decade of weak productivity growth as the government has expanded its role to fill gaps in the economy.
The economic question is therefore not whether the data-centre boom is real. It clearly is. The question is whether it becomes productivity-enhancing capital. If AI and data-centre infrastructure ultimately raise output per hour worked, today’s investment may be part of the solution. But if it mainly adds servers, land use, electricity demand and imported capital equipment without a meaningful lift in productivity, then it becomes another example of aggregate growth without a per-capita dividend.
That is the risk. Australia could become busier without becoming richer. The pie may again get bigger, but not necessarily the slices…
Productivity is the missing link
Productivity is the central issue. The National Accounts show an economy that is adding people, labour hours, capital expenditure and government services, but not enough output per person.
Barrenjoey’s trend productivity growth, shown below, outlines negative growth post-pandemic. Using 5-year averages for the smooth green line shows that the economy’s supply-side problem is not just a short-term issue. The post-pandemic period has been characterised by weak productivity, which makes every other policy trade-off harder.
Figure #6: Trend productivity growth has been negative post-pandemic – and systemically weaker since 2000 – per cent growth
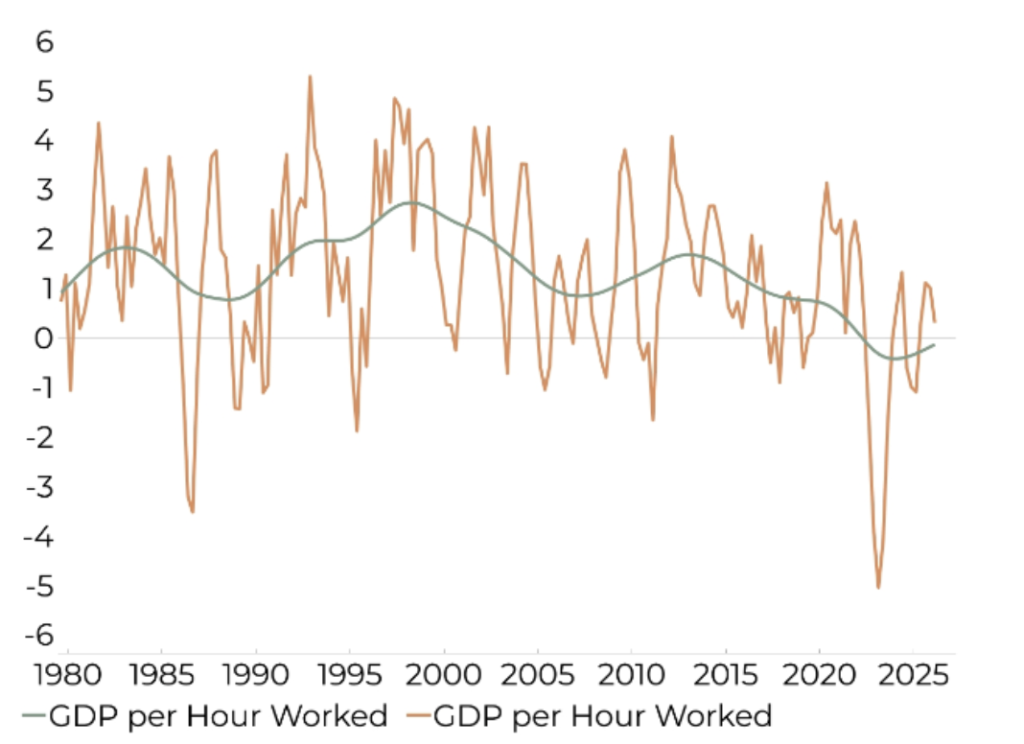
Source: ABS National Accounts, Barrenjoey Research
The numbers on productivity aren’t getting any better; non-farm labour productivity fell 0.6% in the quarter and was only 0.1% higher over the year. The weakness was evident in both market and non-market sectors, with non-market labour productivity falling to its lowest level since 2011, although measurement is difficult and compositional effects matter. Figure #7 below, showing market versus non-market productivity, is the cleanest chart for illustrating the split.
Figure #7: Productivity – weak growth in the market since COVID, falling everywhere else
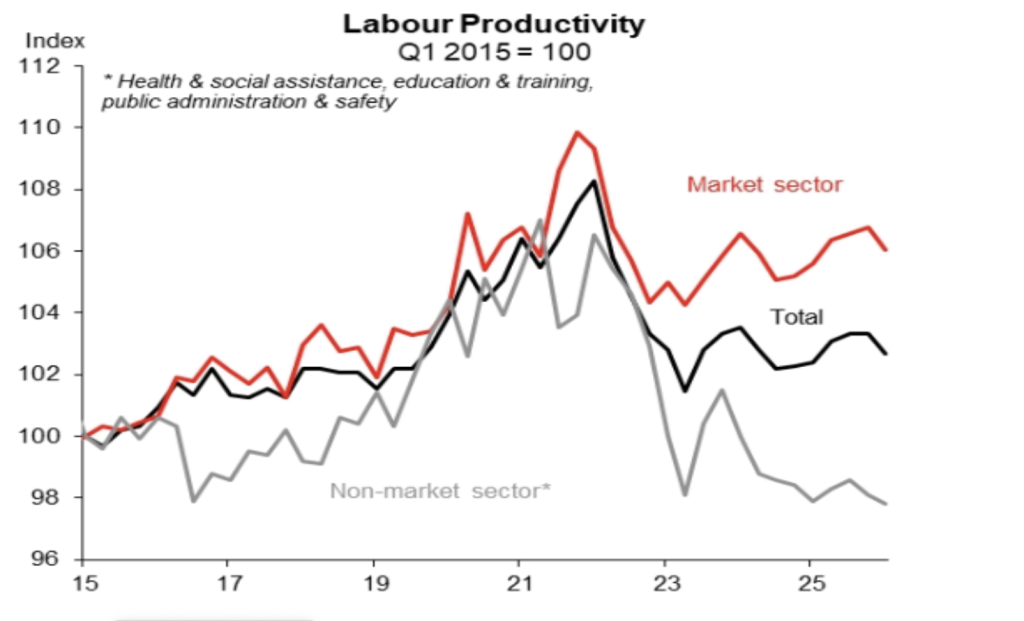
Source: ABS National Accounts, Macquarie Research
This matters because the non-market sector is where much of the population-service obligation sits: health, education, care, public administration and related services. These are essential, labour-intensive services, but they are difficult to make more productive quickly. Ageing adds another layer of pressure, particularly in health and care. The result is a larger economy, a larger public-service task, but not necessarily a more productive economy.
The point is not that these services are unnecessary. The point is that they absorb labour and tax capacity. If productivity does not improve, the cost of servicing a larger and older population rises faster than the economy’s ability to pay for it without pressure on taxes, inflation or service quality.
Population growth has lifted GDP, but not living standards
Population growth is the hidden driver of much of the National Accounts story. It lifts aggregate GDP, supports demand and expands the labour force. But when the population grows faster than the capacity of housing, infrastructure, energy, schools, hospitals, and transport, the economy can grow while per-capita outcomes deteriorate.
The following charts, together with Figure #6 previously on declining productivity trends, represent perhaps the biggest challenge to Australia. Figure #8 shows population growth has been the primary driver of supply-side growth, whilst trend productivity suggests we could have further to fall pursuing similar policies. Together, they tell the story clearly: population is doing much of the heavy lifting, while productivity is not.
Figure #8: Population growth: Primary driver of supply side growth, per cent growth, 5yr average
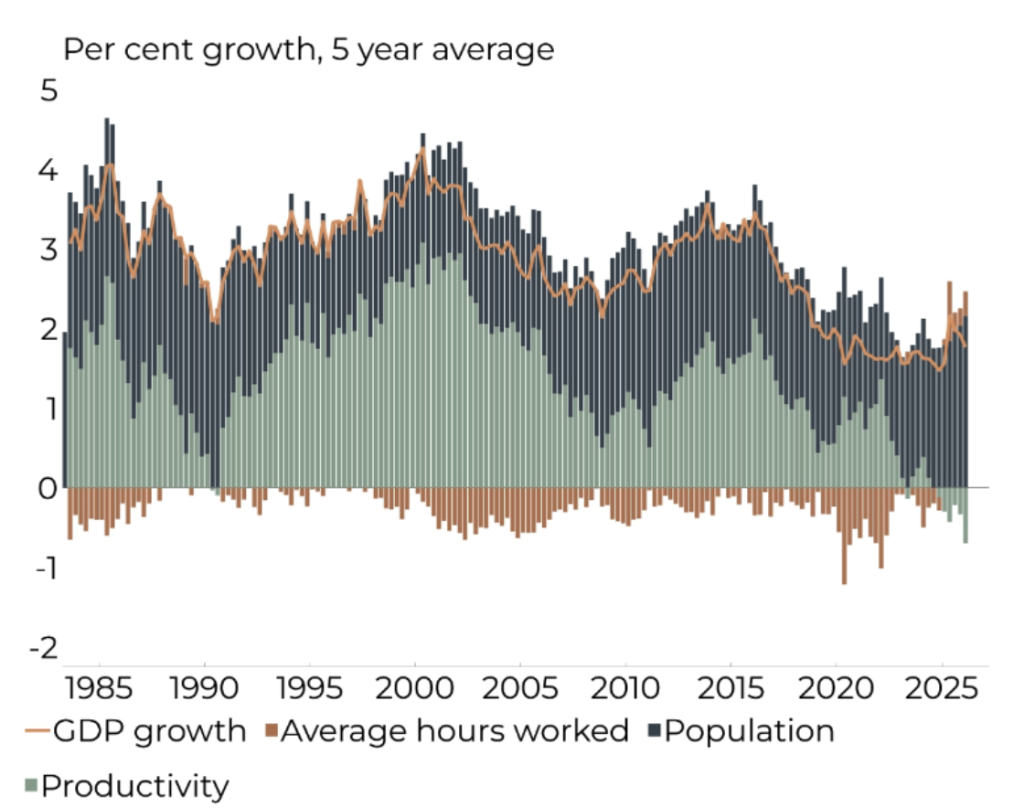
Source: ABS National Accounts, Barrenjoey Research
But ineptitude or malign intent does not underpin productivity outcomes – they are always symptoms or consequences of higher-level economic policies.
This is not a small demographic issue. Australia this week reached 28 million people, far earlier than older planning assumptions implied. The 2002 Intergenerational Report projected Australia would reach only 25.3 million people by 2042, a level that was already surpassed in 2018–19, largely because migration ran well above early assumptions.
In Australia’s case, the government sector has been catching up with past population growth and aging. That is the right framing. We chose to defray these costs across generations rather than see a decline in asset prices. But a larger population requires more classrooms, hospitals, roads, public transport, energy capacity, water infrastructure, childcare and aged-care services. Much of the expansion in government activity is therefore not optional in the short term. It is population-level service provision.
But this catch-up has a cost. Government spending remains elevated as a share of the economy. Macquarie notes that total government spending was 28.6% of GDP, near its recent peak and close to its highest level outside the pandemic period. Barrenjoey’s chart below on government spending as a share of the economy remains elevated is useful here. It shows that the public sector is still carrying a large share of the national demand and service burden.
Figure #9: Government spending as a share of the economy remains elevated
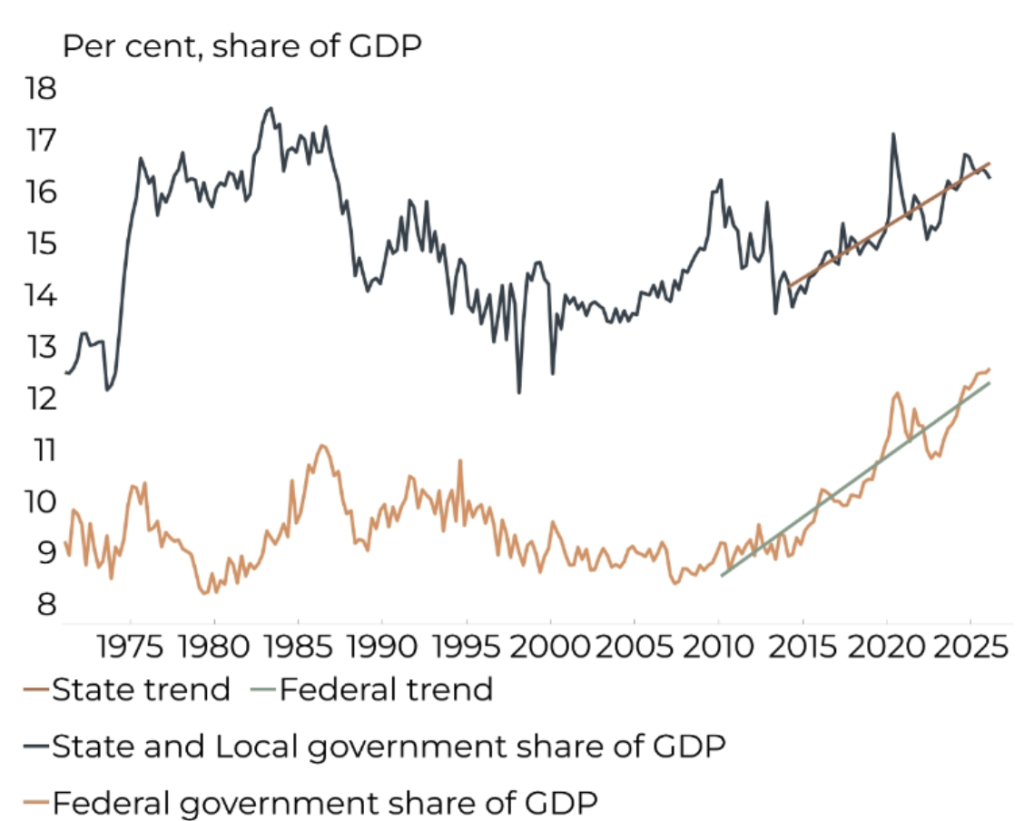
Source: ABS National Accounts, Barrenjoey Research
This is where the population argument becomes inflationary. More people require more services immediately. More classrooms, more health care, more transport, more housing and more energy all require labour, materials, land and capital. If the supply side is constrained, the adjustment comes through higher costs, higher taxes, lower service quality or lower per-capita living standards.
Australia has spent much of the past decade growing by adding people and then trying to catch up with the infrastructure and services required to support them. That model can work if population growth is matched by capital deepening and productivity growth. But the National Accounts suggest the catch-up is incomplete. Government spending remains elevated, non-market activity is large, productivity is weak, and GDP per capita remains below its 2022 peak.
The next phase therefore has to be a productivity catch-up. Without it, population growth risks becoming a source of tax pressure, inflation pressure and weaker living standards rather than a source of national prosperity. Can it be done with elevated migration and our existing tax system, or do we need to wait another generation?
Household income is not as strong as the consumption number suggests
The household sector is the pressure point. Consumption rose 0.5% in the quarter, but the quality of that growth was weak. Half of the quarterly increase reflected electricity consumption effects from the unwinding of rebates, while discretionary spending rose only 0.1%. In per-capita terms, household consumption fell 0.1%.
Again driven by inflation and population growth, nominal household consumption held up, supported by wage and salary income growth of 6% over the year, but households also drew down their savings rate, which fell from 7.0% to 6.2%. Nominal disposable income, after interest and taxes rose only 0.4% in the quarter, with softness reflected in weaker non-labour income. The risk in the remainder of the year includes elevated inflation from the Iran War and higher interest rates feeding through.
Figure #10 below shows that the source of pressure is a mixture of rising interest rates and tax take.
Figure #10: Government spending as a share of the economy remains elevated
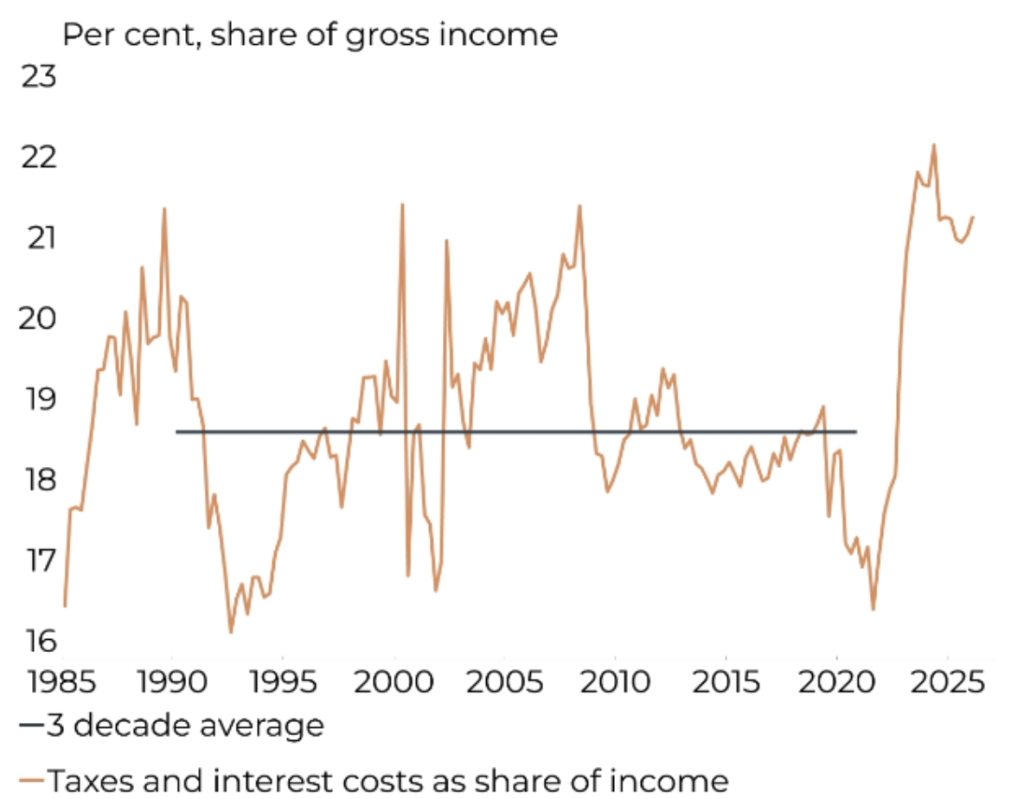
Source: ABS National Accounts, Barrenjoey Research
The point is not to turn the note into an interest-rate discussion. The point is that taxes and financing costs are absorbing a high share of gross household income, leaving less room for discretionary spending.
The household story is therefore not about collapse. It is exhaustion. Labour income is still growing, but it is being absorbed by taxes, debt-servicing costs, energy, insurance, rent, health and essential consumption. Households can maintain spending for a while by saving less, but that is not the same as improving living standards. It is a buffer being used.
This is why the consumption result should not be read too positively. Essential consumption is still rising, but discretionary spending is weak. The household is spending where it must, not necessarily where it wants. That is consistent with a fragile domestic consumer, even if aggregate consumption has not yet fallen.
Why this is a stagflation risk, not just a weak-growth story
The AFR Chanticleer article uses the stagflation frame directly, arguing that beneath the data-centre boom the GDP figures show an economy experiencing the “pangs of stagflation”. It also cites the argument that the data-centre investment boom is important but narrow, not broad-based, and not a major direct employer.
We would express the same idea more cautiously. The risk is a modern Australian stagflation: weak per-capita growth, poor productivity, pressure on household income, elevated essential costs, and investment that adds to capacity pressure before it adds to productivity.
This is the difficult path ahead. Policymakers want weaker inflation, stronger productivity, stronger business investment, more housing, more energy supply, better public services and improved living standards. But starting conditions are poor. The economy is already capacity constrained. Population growth has already created a catch-up in services and infrastructure. Households are already drawing down savings. Productivity is already weak. And the data-centre boom, while positive, is import-heavy and energy-intensive.
The budget and Iran make the starting point harder
The March quarter also predates important later pressures. Macquarie notes that most of the quarter was unaffected by the Middle East conflict and the higher fuel prices that followed, and that consumer and business survey data for April and May pointed to weaker growth momentum in the June quarter.
That matters because the National Accounts already showed household pressure before those later effects were fully visible. If fuel, energy and confidence pressures intensify after the quarter, then the household sector becomes more vulnerable.
The Budget adds a second layer. The issue is not whether any particular Budget measure is right or wrong. The issue is that the fiscal position is being shaped by a population-service catch-up, housing pressure, health and education demand, and the need to fund a larger public-service footprint. That makes it harder to provide short-term household relief without adding to demand. It also makes it harder to lower taxes meaningfully without confronting spending growth or productivity.
Investment implications: the economy is not our portfolio
The investment implication is straightforward and, unfortunately, it supports our current positioning. We are not positioned for a broad, clean rebound in the core domestic economy. We do not want portfolio returns to depend on the marginal Australian household borrowing more, spending more, renovating more, buying more discretionary goods or relying on rising house prices to feel wealthier.
This is not our portfolio.
Our portfolio is deliberately more tangential to the core domestic economy. We prefer businesses whose earnings are linked to global revenue pools, strategic resources, insurance pricing, infrastructure maintenance, industrial services, essential assets or offshore growth platforms. These businesses may be listed in Australia, and some may employ people and invest locally, but the investment case is not simply “Australian GDP goes up”.
A modern stagflationary environment is hostile to businesses that need broad-based household volume growth. It is particularly difficult for discretionary retailers, housing-turnover beneficiaries, consumer lenders and businesses with weak pricing power. They face customers who are spending more on essentials, saving less, and becoming more cautious.
The more attractive exposures are different. We want companies with pricing power, scarce assets, structural demand, global customers, or earnings linked to investment and maintenance cycles rather than discretionary household spending. Strategic metals, energy infrastructure, insurance, selected industrial services and global platforms fit that logic better than businesses exposed to the squeezed domestic consumer.
Asset-heavy, low-obsolescence businesses with pricing power are better suited to an inflationary environment, while consumer discretionary stocks remain vulnerable to margin pressure and discounting. We avoid relying on the weakest part of the domestic economy.
The National Accounts do not tell us to change course. They tell us to be more wary of assuming Australia has a strong, diverse domestic economy that will naturally carry corporate earnings higher. It may not. Too much growth is coming from population, imported capital, government catch-up spending and lower household saving. Too little is coming from productivity.
Until that changes, the portfolio should remain focused on businesses that can operate beside the domestic economy rather than depend directly on it.
The information in this article is of a general nature and does not take into consideration your personal objectives, financial situation or needs. Before acting on any of this information, you should consider whether it is appropriate for your personal circumstances and seek personal financial advice.