
The 2025 financial year has been shaped by a dynamic mix of economic shifts, policy recalibration, and geopolitical developments that continue to test established market assumptions.
Looking more broadly, the global economic and political landscape in FY-25 has been shaped by significant challenges and unexpected developments. Arguably, the greatest single source of volatility has been the election and early presidency of Donald Trump, whose return to office has unsettled markets and policy norms alike.
Many established pillars of economic thinking have been tested, sparking renewed debates over the roles of tariffs, protectionism, and central bank independence. These tensions have played out within an increasingly bipolar geopolitical context, heightening uncertainty and underscoring the value of a resilient, diversified investment approach to navigate the years ahead.
Regular readers of Investment Matters will have noted that the key to markets in FY-25 has been the avoidance of panic. Our deliberate focus on portfolio diversification measures was well rewarded. These included gold, ongoing exposure to the type of companies subject to takeover, and regular rotation of positions as value emerges in pockets of the market, including in energy and technology, in recent months.
In short, our clients enjoyed a very good year. And our five-year performance has now consolidated to outperforming comparable wealth managers.
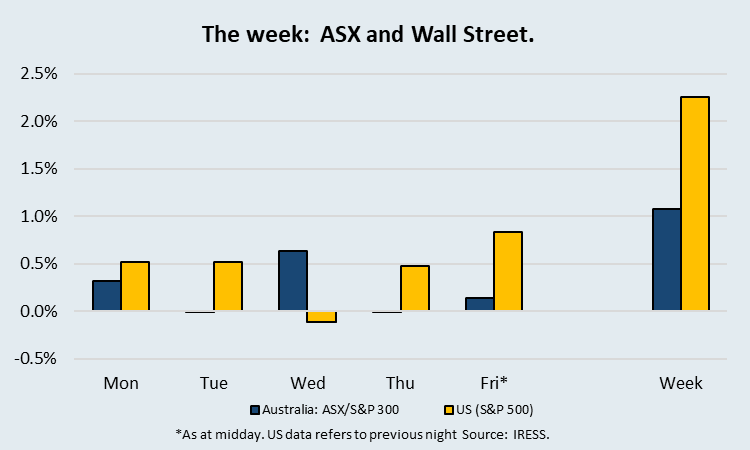
The Market
Diversification
In this environment, diversification has once again demonstrated its value as a core principle of sound portfolio construction. For our clients, diversified exposure across the major sub-portfolios; Australian Equities, International Equities, Property Securities, Income Securities, and Alternatives, aims to smooth out the variability inherent in any single asset class, aligning long-term returns with individual risk profiles and income needs.
Sometimes the experience of diversification is stark, with some asset classes performing very well, such as Equities in FY-25, and others providing more mediocre returns, including Income and Alternatives. Overall, however, this was a very pleasing year, with total returns achieved by clients directly related to their risk profile. Higher-risk portfolios outperformed lower-risk portfolios by between1% and 3%, especially those with less than 50% invested in equities.
Note: From Tuesday, the First Samuel client portal will feature portfolio returns for FY-25. The returns are after fees but do not include the considerable benefit of franking credits. Portfolio returns that can be compared to headlines should consist of franking credits and other adjustments. These finalised returns, which do not include all pricing and tax information, are not available until months after the financial year-end and will be included in your Personal Investment Reviews (mid-August) and final Accountants Pack (early October).
Diversification, CBA and indexes in FY-25
The diversification across different types of investment is commonly well understood, based on our experience. However, diversification within an equity portfolio, especially an Australian equity portfolio, is poorly appreciated.
First Samuel invests in sub-portfolios of Australian companies, designed to create diversified exposure to a range of economic opportunities offered by listed Australian companies, rather than a diversified exposure to the ASX market itself.
ASX300 not appropriate
Despite what the textbook suggests, the total share market, as represented by the top 300 (ASX300) companies, is neither an automatic benchmark for performance nor an automatically diversified option for a long-term investor. Yet increasing passive ETFs and industry funds forced by government policy to track such indexes closely are risking client funds under the cover of “market returns”.
For decades, it has been recognised that the ASX is heavily exposed to banking and mining profits, and that it presents an imperfect picture of the Australian economy, being skewed towards higher leveraged outcomes in house prices, interest rates and commodities’ pricing than would otherwise be sensible.
The ASX, measured by market capitalisation, which serves as the benchmark, lacks a focus on future drivers of growth and new opportunities in the economy. In response, active managers have varied their exposures and added a range of non-ASX investments to client portfolios. However, increasingly active management is playing a minor role in the face of policy changes in large superannuation funds.
CBA follies
But the benchmark lingers as a driver of behaviour, and its impact has been magnified this year by one stock, CBA. CBA ended the year with an index weight of more than 12%, meaning one in eight dollars invested in Australian shares is “meant” to be invested in CBA.
We believe that a 12% portfolio concentration is too high for any stock, regardless of the company’s activities, but especially for a bank. History also suggests that such concentration rarely lasts.
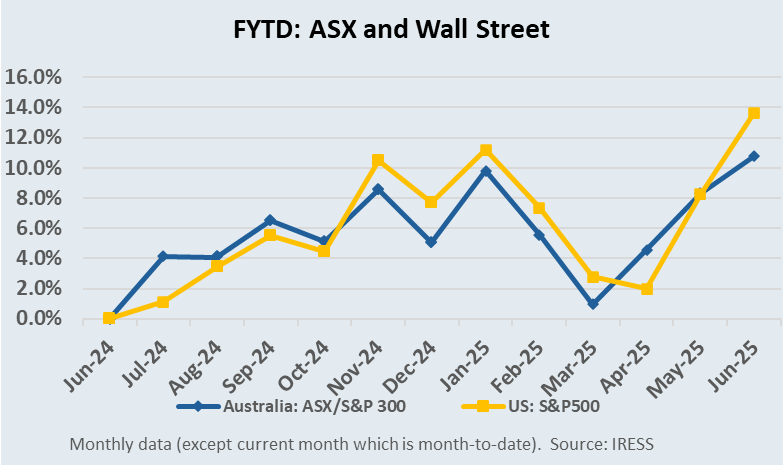
CBA rose by more than 48% in FY-25, while the remaining three large banks performed in line with the market. This was despite limited earnings growth; that is, the price-to-earnings ratio also rose 48% for the same earnings, and there were also limited dividend growth. Investors could earn more by walking into a CBA branch and depositing their funds than by investing in the risks of the banks themselves in 2025.
Of the 13.7% return of the ASX overall return, including dividends, CBA provided 3.5% of the return. Yes, you read that right: without CBA, the benchmark return, despite its flaws, was only 10.3%.
However, in FY-25, growth built on growth as CBA’s share price momentum continued, albeit not in its underlying business. More and more new money entered the index-tracking superannuation industry and ETFs, supporting CBA’s share price rise.
Young workers in retail or any other industry choosing an industry fund option are likely putting one in eight dollars of the 12% garnished from their pay into CBA. This isn’t the free kick CBA handed to their grandparents on privatisation, but the world’s most expensive ever bank. Based on aggregate data and our experience, it is even worse for the young, as their grandparents are actively selling overpriced stock to them.
Does this make CBA a bubble? There are a couple of generally accepted signs, including temporary mania (CBA’s share price at the end of last week was up 34% since March 18th, versus the market rebounding only 9%); irrational exuberance; adoration of the company and its operations; and, of course, FOMO.
But one element that famed investor Howard Marks concurs with your author on that stands out in the discussion about bubble-like stocks is the conviction that there is “no price too high”. Our view is that there is always too high a price to pay for an asset.
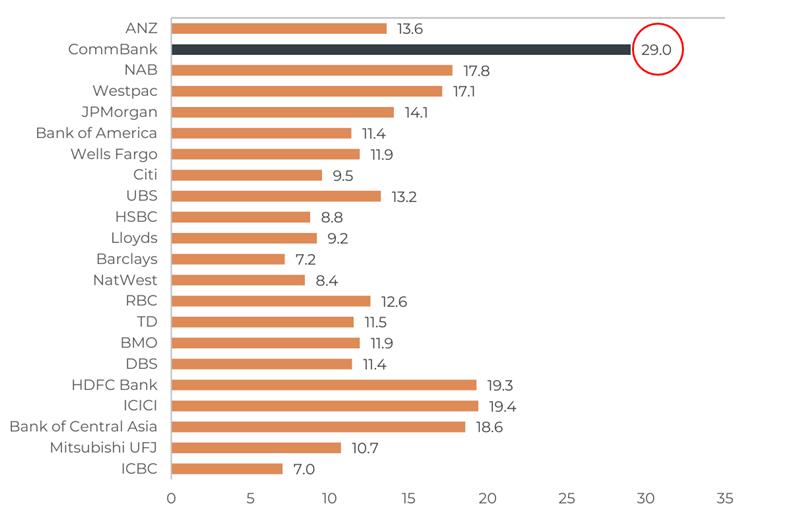
In the case of CBA, that price was reached in 2024, not just in June 2025. But “no price is too high” has led to CBA being the most expensive developed market bank (in terms of earnings) ever.
Figure 1 & 2: CBA’s bubble-like valuation – Prospective PE multiple of 29x

This isn’t just an Australian trend; markets around the world in 2025 have their own CBA or CBAs. As they are rarely in the same industry as CBA, they share the feature of being the largest or near the largest stock in the index.
When does this trend unwind? This is the most interesting question, but not the most important in our view. Theoretically, when price is no object, the price will fall when the underlying premise for price being unimportant changes. There is excellent research into global markets, which shows that corrections in such stocks, when cracks appear in the mask of perfection, can be vicious.
But for First Samuel, the decision to hold out on CBA is best explained by a visit to Amsterdam in 1630. The correct long-term investment decision is to buy the mansion on the Amsterdam Grand Canal, rather than speculate on the tulip itself during the Great Tulip Bubble.
Australian Equities
Our Australian Equities sub-portfolios delivered strong results this year, supported by healthy corporate earnings, sustained commodity demand, and robust dividend streams. The role of franking credits was particularly notable in FY-25, with companies such as Healius Limited offering substantial fully franked dividends that added meaningfully to investors’ after-tax returns. These factors combined to reinforce the appeal of domestic equities as a core source of growth and income.

Some of the highlights in the portfolio were our exposure to gold. The best two performing positions were De Grey Mining and Catalyst Metals. Catalyst generated an average return in client portfolios of over 300 per cent in FY-25. De Grey Mining benefited from a rising gold price and a takeover.
Figure 2: Gold Price in USD/oz

Source: GoldPrice.org
We were especially pleased to generally generate (individual account results varied) higher returns than the index, despite its lopsided nature. Our returns, especially after taxes, were substantially higher than the after-tax returns experienced by ETFs or industry funds.
Clients who benefit from a range of smaller investments, including DUG Technology in FY-24, saw a retracement in these still profitable positions.
Unlike the previous three years, the clients pursuing a conservative equity allocation saw a moderately lower return as large companies in general tended to perform more closely to the broader market (excluding CBA).
Other highlights in the portfolio have included Life360. The most significant detractors from performance for the year were Nufarm Limited, Innovate Access Group, and Johns Lyng Group.

International Equities in FY-25
International Equities provided powerful returns in FY-25. Global markets generally advanced, with currency movements typically adding to gains for Australian investors. Our approach to increasing exposure to European shares was successful, although Japan and mid-cap US shares did not achieve the same dizzying heights as the returns generated by the Magnificent Seven US stocks, which dominate global indexes.
Through FY-25, we will continue to benefit from the run-up in a narrowly concentrated US equity market, while also reducing our overall exposure to this part of the International Equity market. Similarly, concerning the falls in the AUD, which reached its lows around Trump tariff announcements in April, we have increased hedging in anticipation of a slowing rising AUD in the coming years.

Property
Property has played a nuanced role in overall portfolio performance. For many investors, property exposures have served as an effective diversifier, mitigating volatility in other asset classes. Outcomes varied depending on individual asset selection and risk profiles, with segments of direct and listed property delivering solid income streams and capital growth. At the same time, other areas felt the impact of changing circumstances (including HMC Capital) and evolving tenant demand (Mirvac).

Income Securities
Returns in the Income Securities sub-portfolios were softer this year, reflecting the impact of changing interest rate dynamics and persistent pressure on credit spreads. Defensive yield strategies, which have historically provided a steady income buffer, delivered lower returns amid shifts in central bank policy and market expectations.
A small number of adverse credit events in long-held positions also impacted our portfolio. This detracted more than 3% from average portfolios. We would note, however, that on a 3 and 5-year view, the performance of income securities amongst First Samuel clients has exceeded straightforward benchmarks and industry comparables.
Interestingly, FY-25 has seen a move back towards government bonds in the portfolio after many years of avoiding such holdings. The avoidance of government bonds in the period from 2019 to 2023 was key to generating long-term performance. We now see strong risk-adjusted returns available in a range of bond strategies.

Alternative Securities
Performance in the Alternatives sub-portfolios has also been mixed. We have deliberately maintained high levels of cash in this sub-portfolio, providing the flexibility to capture a range of new opportunities as they arise. The unwinding of exuberance in parts of the private equity market, along with the failure of some early-stage companies, contributed to weaker-than-expected returns over the year.
Nonetheless, this segment remains a critical diversifier, with new opportunities emerging as market dislocations create attractive entry points for patient capital.

Tax Management and Policy
The highly influential market economist and former colleague of the author, Tim Toohey, received attention this week regarding research he conducted on the performance of SMSF funds in Australia as a whole. Amongst other findings, which included notes on limited exposures to International Equities and a preponderance of cash in SMSFs, he noted a difference in long-term returns.
He concluded that SMSFs in general have harvested far greater tax benefits than large superannuation funds. He noted that two possibilities can explain why SMSFs generate greater post-tax returns. The first possibility is that they have a far greater proportion of members in the retirement or pension phase, where no tax is paid, thus boosting total SMSF returns. The second is that they are employing more tax-advantageous strategies during the accumulation phase.
Based on the age distribution of members in SMSF funds and large super funds, Toohey concluded that it could not all be explained by age alone, implying that SMSF members must also be utilising other tax-effective strategies.
As a fund manager with a mix of SMSFs and other structures, we can attest to the benefits, especially after-tax, of the type of tax-aware investment management that forms the basis of our general operating rhythm.
Active management of clients’ positions on an after-tax basis provides better returns in our minds than being pooled in an ETF or industry fund, subject to uncertain future tax liabilities upon exit, and ongoing taxes paid within the ETF and fund, despite the investor’s inactivity.
Although we don’t tend to promote widely the types of benefits that Toohey exposes, we are confident that the Managed Discretionary Account structure and mix of SMSF and other entity types can consistently generate benefits not available in different formats.
However, as seen in the $3 million superannuation tax debate, the tax outcomes for higher-balance clients in effective structures and strategies will capture the attention of policymakers. In the AFR Chanticleer column, 1st July, Chanticleer noted, “Toohey’s research tells us that this might be the start of a much bigger fight. Rightly or wrongly, governments struggling to fund big spending commitments – healthcare, aged care, the NDIS, defence – and keep budget deficits in check will keep coming back to super tax concessions as a potential target.”
At First Samuel, we pride ourselves on navigating a balance between the hype and the considered, well-planned approaches that consistently respond to changing policy and tax rules. In terms of people, we overinvest in tax law capacity, structuring expertise, and single-account-level strategic advice, so that we not only adapt to change but also build approaches that are more resilient to change.
Central to this type of advice, and crucial to harvesting the after-tax benefits of the structures highlighted by Toohey and the AFR, is building portfolios that respond to a client’s entire financial position. At First Samuel, we do not need to manage all of your wealth, but we want to ensure that the wealth we do manage reflects your entire financial position.
Next financial year
As a baseball aficionado, I have probably used this quote before. Still, whenever I pause to write about next year, I remember Yogi Berra noting, “It’s tough to make predictions, especially about the future.”
Equally, I am sure I have mentioned that I am excited about the portfolio going into the following year.
If you are interested in to learn more about how we can help position your portfolio for growth, get in touch for an obligation-free consultation.

Let’s be a little more reserved with our outlook.
First and foremost, equities generally rise at a rate slightly faster than the nominal economy and marginally faster than the 10-year bond rate plus a premium of 4-6%. If we know no more, we could assume that returns of 7 to 10% are expected for equities, slightly more than 5% for income securities, and a range of outcomes for property and alternatives.
The added features of July 2025, however, include a changing global landscape, which we believe will provide more opportunities for investments outside the US. This change has been reflected in your portfolios over recent weeks.
We also anticipate significant rotation in value within the Australian market, which is likely to impact index returns. We hold a moderate amount of cash for new opportunities, which is exciting.
We acknowledge the presence of political and geopolitical uncertainty. Still, we continue, as we have in recent years, to focus on our core investment themes and our consistent approach to stock selection.
The themes are
- Inflation and higher interest rates
- Decarbonization
- Market power, especially pricing power
- Technology and growth – at the right price
- Strategic/Privileged and Globally Significant Assets or businesses
- Gold
The consistent approach to stock selection highlights
- Cash flow yield – the companies that generate actual free cash flow at a reasonable price
- Optionality – companies that possess innovation, balance sheet strength and company plans or assets that have the probability of generating significant value.
- Value – we prefer to buy companies that are cheap and demonstrate patience
- Takeover target – we value companies like how other companies’ management teams, their boards, and private equity firms are likely to value them. This disciplined approach means we are, and have demonstrated this over many years, more likely to own companies subject to takeover than the ASX average.
With this approach and these themes, we are confident of a successful FY-26.
The information in this article is of a general nature and does not take into consideration your personal objectives, financial situation or needs. Before acting on any of this information, you should consider whether it is appropriate for your personal circumstances and seek personal financial advice.