
Estimated reading time: 24 minutes
Copyright 2026 First Samuel Limited
Read the previous Investment Matters here
The market
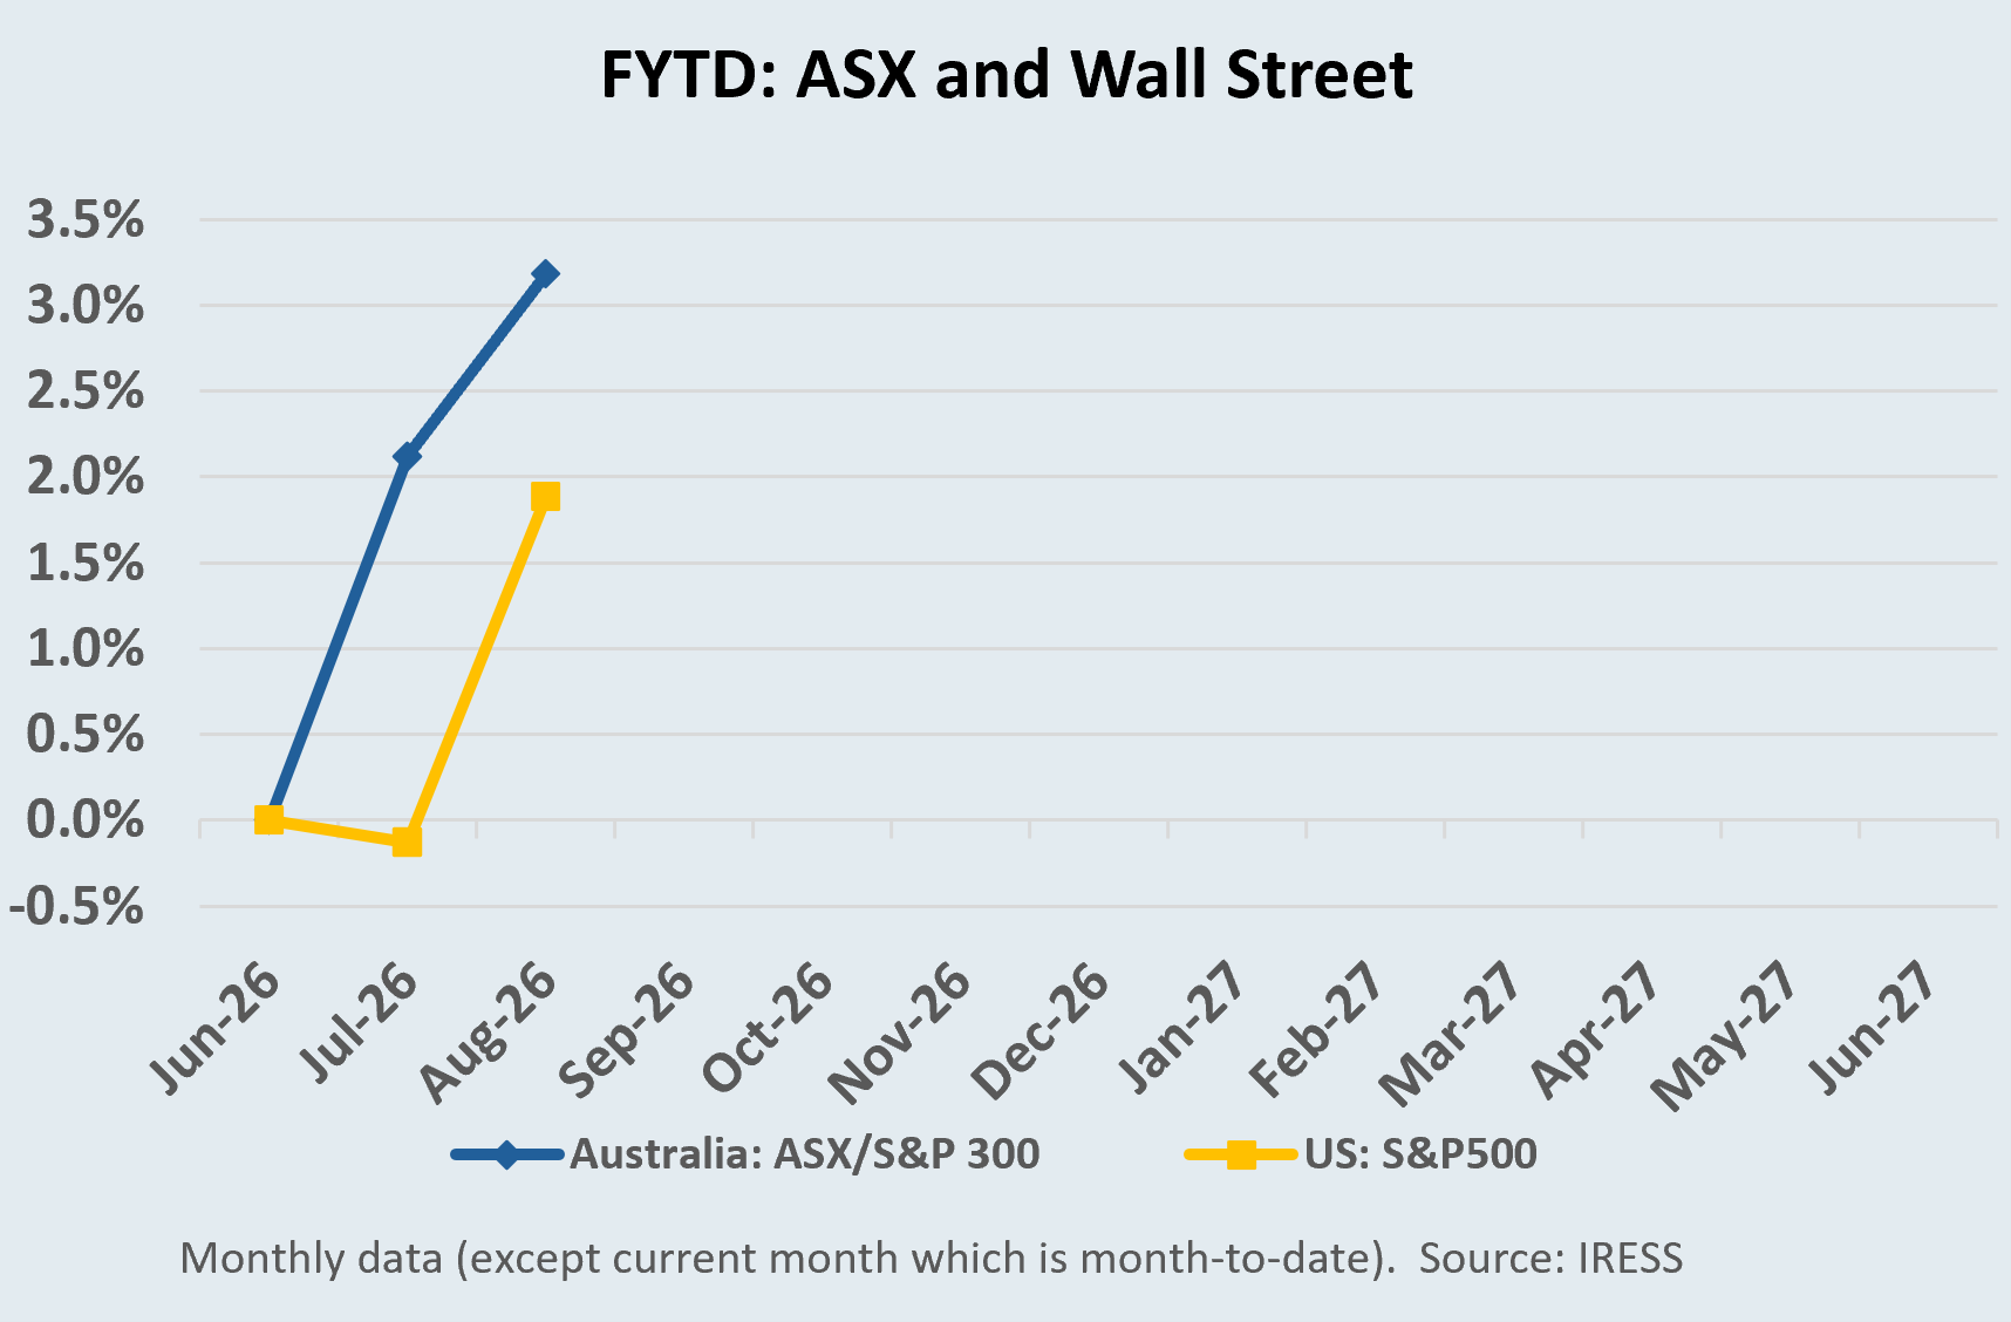
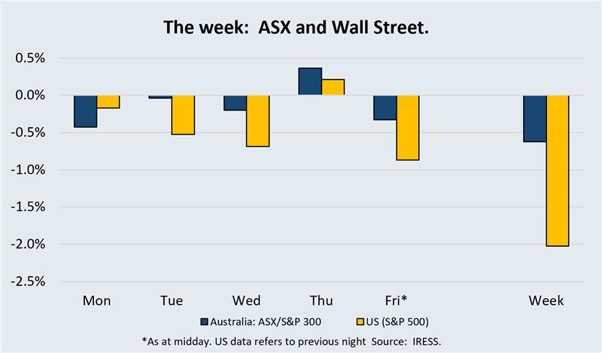
The slowdown is becoming harder to ignore
Two developments dominated the week.
Reliance Worldwide, one of the largest holdings in clients’ portfolios, received a $ 4.75-per-share takeover proposal from Brookfield. It followed EQT’s bid for Cleanaway only days earlier. Two of our largest holdings have therefore attracted takeover proposals within a week.
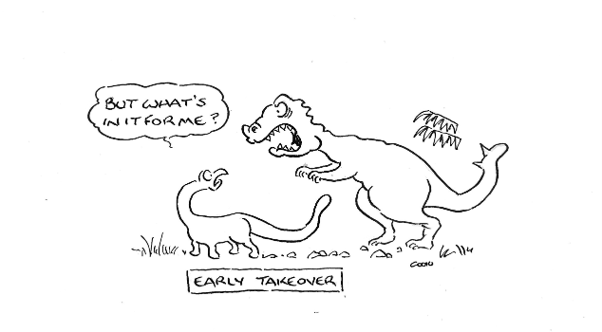
At the same time, reporting season produced increasingly clear evidence that the domestic economy is slowing.
Over the past three weeks of Investment Matters we have focused on the prospect that tighter financial conditions would increasingly affect activity, credit demand and corporate earnings. Reporting season is now providing the evidence.
The most useful information is increasingly found beneath the full-year headline numbers. Fourth-quarter trading, July updates and changes in forward expectations are deteriorating more quickly than the annual results suggest.
The market has responded aggressively. JB Hi-Fi fell more than 12% after its result. NAB fell almost 5%. CSL rose more than 17%. Reliance Worldwide rose sharply following Brookfield’s proposal.
These movements reflect more than the quality of individual results. They reflect rapid changes in expectations. As such, when we look at the movement in aggregate, we can see in the figure below that, although companies reported slightly higher earnings (FY26), analysts have downgraded expectations for FY27, despite the higher starting point. Downgrades are across the board: commodities, financials and industrials.
Figure 1: Amcor $650 USD merger synergy target reaffirmed
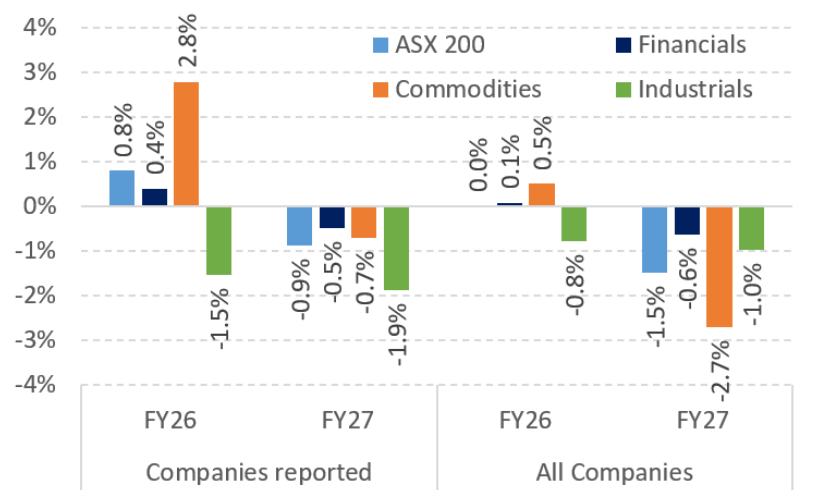
Source: MST Marquee
Credit is transmitting through the economy
The banking results are central to this shift. NAB reported a 15% quarterly decline in home-loan applications, including weaker demand from both owner-occupiers and investors. Its non-performing loan ratio remained contained, but loans classified as requiring closer attention increased.
That combination matters. The immediate issue is not a bad-debt crisis. It is the simultaneous appearance of weaker credit demand and early signs of greater financial stress.
Similar trends have appeared across the other major banks. Mortgage applications have fallen materially, particularly among investors. The standard transmission mechanism from weaker housing credit is familiar. Fewer transactions mean lower revenues for agents, brokers, conveyancers and removalists. They also reduce spending on appliances, furniture, renovations, landscaping and other housing-related consumption.
But there is a broader effect. Bank lending creates deposits. New credit therefore creates additional liquidity and purchasing power within the economy.
That liquidity does not remain confined to the original housing transaction. It moves through households and businesses. Vendors receive cash. Agents earn commissions. Builders and tradespeople receive work. Retailers sell goods. Suppliers replenish stock.
The second-order effects are equally important.
When activity is strong, businesses invest with greater confidence. A tradesperson buys another vehicle. A contractor employs another worker. A retailer carries more stock. A small business brings forward capital expenditure. Investors commit to new projects because demand and cash flow are visible.
Credit growth therefore supports activity through both liquidity and confidence. The reverse is now beginning. As new lending slows, less incremental purchasing power enters the economy. Existing loans continue to amortise. Transactions weaken. Cash flow through housing-related industries falls. Businesses become more cautious. Investment is delayed. Hiring slows. Highly discretionary spending is reduced first.
This is why we expect the transmission of weaker loan growth to be both faster and broader than a narrow focus on housing turnover would imply.
Retail is beginning to confirm it
The fourth-quarter retail numbers were particularly revealing. JB Hi-Fi reported another strong full year, but trading deteriorated markedly as the year progressed. Australian comparable sales growth was around 5% in the first half. By the fourth quarter it had turned negative. July weakened further.
The Good Guys also recorded softer trading, while e&s, which is particularly exposed to appliances, renovations and higher-value household expenditure, was weaker again.
Temple & Webster told a similar story. Revenue since the beginning of July was sharply below the comparable period.
Credit does not explain every movement in retail activity. But the emerging pattern is increasingly coherent.
CSL: expectations matter
CSL provided the clearest example this week of why result-day share-price movements need to be interpreted carefully. Readers will recall our recent discussion of the company. Our concern was not that CSL needed immediately to recover its historical growth rate. The more immediate issue was whether investors could regain confidence that conditions had stopped deteriorating.
The result provided some evidence of that.
The headline numbers were poor. CSL reported very large impairments, much of them associated with Vifor. The scale of the writedowns confirmed what the market had already concluded: the Vifor acquisition destroyed a substantial amount of shareholder value.
Yet CSL shares rose more than 17% on the result and had recovered strongly from its 30 June level.
There is no contradiction. Share prices respond to the difference between outcomes and expectations. By June, expectations for CSL had been reduced substantially. The market did not require a return to historical growth. It required evidence that the sequence of deteriorating expectations was nearing an end. The result provided enough of that evidence.
When private capital sees more value
Reliance Worldwide brings the same issue into sharper focus. Brookfield has offered $4.75 per share for the company. It is the fourth proposal from Brookfield and represents a substantial premium over the pre-bid market price.
Takeovers are core to our portfolio decisions because we consistently value businesses across the medium term rather than on current earnings alone. That requires an assessment of assets, competitive position, replacement value and underlying earnings power. At times, those assets become most visible when another investor seeks to acquire 100% of them.
Reliance Worldwide is currently experiencing weak cyclical conditions. US housing activity remains subdued. Tariffs have created additional costs and uncertainty. Copper prices are elevated. Current earnings are consequently well below what we regard as a reasonable measure of the company’s earnings power through the cycle.
Brookfield is not purchasing one year of earnings. It is seeking permanent ownership of the entire business. That distinction is fundamental.
A cyclical trough should not automatically determine the price at which long-term ownership is transferred. We are therefore disappointed that $4.75 is considered sufficient to move discussions forward, particularly when Reliance has traded materially above that level in recent years.
We had a similar concern with the Cleanaway proposal last week. In our view, that bid is at least 10% too low. This is where valuation discipline matters. Markets are highly efficient at incorporating changes in near-term earnings expectations. They are less consistent when distinguishing temporary weakness from permanent impairment.
We will meet Reliance CEO Heath Sharp this week and will reinforce our view that $4.75 represents a second-best outcome that warrants further consideration. We are prepared to be convinced that selling is ultimately the best available outcome. But the threshold should be high.
Indeed, there is an obvious irony in the proposal. The attributes that make Reliance attractive to Brookfield today are largely the same attributes that make us reluctant to sell it at a cyclical low.
I would be very interested in owning Reliance inside a Brookfield vehicle after a takeover. A private owner would be able to invest, restructure, and improve the business, free from the short-term pressures of the ASX.
That is also a useful reminder of the role of Alternative Assets in diversified portfolios. Private equity, longer-duration investments, and early-stage companies offer exposure to businesses and investment horizons that listed markets may not always replicate. Their advantage is not simply that they are private. It is that the ownership structure can permit a longer period for value creation before market judgement intervenes.
What reporting season is telling us
Three weeks into reporting season, the principal themes are becoming clearer.
- Domestic activity is slowing.
- Mortgage demand has fallen sharply.
- Early signs of loan stress are increasing, even while headline credit losses remain contained.
- Housing-related and discretionary spending is weakening.
The fourth quarter and July numbers suggest that the deterioration accelerated late in FY26. At the same time, the market is repricing companies rapidly as expectations change.
This week we focus on BlueScope Steel, QBE, Seek and Amcor. But there were also many other results.
| Company | Event & Market Reaction since Result | Commentary |
|---|---|---|
| BlueScope Steel (BSL) POSITIVE | FY26 Results 17th August Movement since June 30 2026: +5.7% Movement post result: -11% | See detailed report |
| Reliance Worldwide (RWC) POSITIVE | FY26 Results 18th August Movement since June 30 2026: -7.7% Movement post result: +22% | Profit result overshadowed by takeover offer. We viewed the FY26 result as firm evidence of both the underlying value of the business and the progress the company has made in recent years to derisk earnings and expand its product range, thereby reducing reliance on higher-priced copper. Underlying conditions remain challenging in the US, but medium-term earnings power remains. See above for analysis of takeover. |
| QBE Limited (QBE) NEUTRAL | FY26 Results 14th August Movement since June 30 2026: -6.8% Movement post result: -7.6% | As a long-term position, QBE has provided exceptional returns over the past 5 years. We trimmed circa one-third post-June 30thon valuation grounds. The FY26 results are structurally pleasing – profit rose 4%, and the interim dividend increased 6% to 33 cents. The central investment case remains intact. QBE is producing returns materially above its 15%+ medium-term ROE target. In terms of P/E (price-to-earnings), QBE remains inexpensive and continues to benefit from higher bond yields. |
| Emeco Holdings Limited (EHL) POSITIVE | FY26 Results 20th August Movement since June 30 2026: +7.2% Movement post result: +3% | Solid result in moderate operating conditions. Excellent cash flow and balance sheet improvement. The business continues to pivot towards higher-value, lower-capital-maintenance through its Force Workshops business. The highlight of the result is the $50+m share buyback, which makes perfect sense given EHL trading below NTA (Net Tangible Assets). |
| Healius Limited (HLS) NEUTRAL | FY26 Results 19th August Movement since June 30 2026: +14% Movement post result: +6.2% | Challenge to manage wage inflation against low single-digit revenue growth. Some evidence of success, leveraging technology (AI) to gain efficiencies. Asset sale price (Agilex) may surprise to the upside and will significantly improve balance sheet. |
| Goodman Group (GMG) NEUTRAL | FY26 Results 19th August Movement since June 30 2026: -2.1% Movement post result: -4.1% | Result in line with expectations. Concerns re data centre rollout pace and general development activity across the sector. |
| CSL Limited (CSL) POSITIVE | FY26 Results 18th August Movement since June 30 2026: +17% Movement post result: +28% | Just needed to show signs that the worst is behind it. Did just that. Constructive commentary around revenue growth and margin very well received. |
| Stockland Group (SGP) POSITIVE | FY26 Results 19th August Movement since June 30 2026: -1% Movement post result: +13.5% | In-line result but guided to better FY27. Data Centre JV development with EdgeConnex was a positive surprise and offset expected softness in Managed Communities demand. |
| Mirvac Group (MGR) POSITIVE | FY26 Results 19th August Movement since June 30 2026: +1% Movement post result: +6.9% | IPositive surprise on Managed Communities settlements (in contrast to SGP) combined with strong presales which bolsters FY27. General real estate pressures remain and margins might get tighter. |
| OF INTEREST | ||
| National Australia Bank (NAB) NEGATIVE | FY26 Results Movement since June 30: +9.2% Movement post result: -6.5% | NAB provided a similar update to the other Big 4 banks. Revenue growth is weak, margins are soft, and demand is cratering. Yet NAB is trading at historically high levels. When we add concerns about NAB’s SME exposure amid a broad macro slowdown, the case for limited exposure remains. NAB and ANZ remain our preferred exposures but given the capital strain of growing business loans faster than a falling mortgage market ultimately impacts dividends, we are comfortable remaining significantly underweight the Big 4 banks. |
| JB HiFi Limited (JBH) NEGATIVE | FY26 Results Movement since June 30: +1.5% Movement post result: -13.3% | As the national best retailer, JBH results are eagerly awaited. Operationally, the company remains strong, but sales began to slow in the 4Q and have continued to weaken. This surprised the market, as it has increasingly viewed JBH becoming more staple-like (think supermarket) and less discretionary. This is incorrect. The stock remains expensive (P/E 16.7x versus our view of 12x) and subject to the impact of falling housing turnover (Good Guys, E&S Trading). |
Amcor – Full year F26 Results
Amcor: Volume Inflection Emerging, but Not Yet a Clean Turnaround
Amcor’s FY26 result offers the first tangible evidence that its multi-year volume weakness may be stabilising. Group volumes turned positive for the first time in two years, up 0.5% in the June quarter — a 200bp sequential improvement — with management noting July trends held up and pointing to a broader customer pivot toward volume over price. Independent industry volume trackers broadly corroborated the trend, adding some credibility beyond company commentary alone.
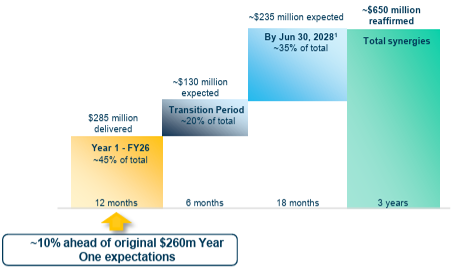
Synergy delivery has also consistently outpaced targets, with FY26 synergies of $285m landing 10% ahead of the original goal, and a further $650m long-term target reaffirmed through FY28.
Figure 2: Amcor $650 USD merger synergy target reaffirmed
Source: Macquarie Research, FactSet
That said, the improvement should be kept in context. The volume gain was flattered by an easy prior-year comparison, and one quarter of positive growth — largely concentrated in Flexibles — doesn’t yet confirm a durable inflection after several years of disappointing delivery. Price/mix remains a modest drag, and free cash flow missed guidance by roughly $200m on higher receivables and inventory, leaving leverage elevated at ~3.5x. Resin, a key input, has been volatile around the Mid East conflict, but has been managed proactively and had little impact in the latest period.
Management is targeting a $500m working capital unwind over the next 12 months to fund deleveraging toward 3.0x — a target that will need to be hit, not just guided to. Guidance for the upcoming transition period (six months to December) also came in a little below expectations on higher interest costs and accruals, tempering near-term earnings momentum even as medium-term EPS growth targets remain intact.
On the share price: the recent rally, aided by a lower oil price and improving FMCG volumes, has been meaningful off the June lows, but largely represents a partial recovery of this year’s earlier weakness rather than a re-rating on fresh conviction. Valuation remains undemanding on a forward earnings and yield basis, but the case now rests more on execution — sustained volume delivery and working capital recovery — than on multiple expansion alone.
BlueScope Steel– Full year FY26 Results
The takeover thesis was right
Clients will recall that BlueScope was subject to a takeover proposal from SGH and US steelmaker Steel Dynamics. The final proposal was $32.35 per share in cash, or approximately $34 including dividends already announced. We would have been pleased to support it. SGH was well placed to improve the Australian operations, while Steel Dynamics was uniquely positioned to extract more value from BlueScope’s high-quality US assets.
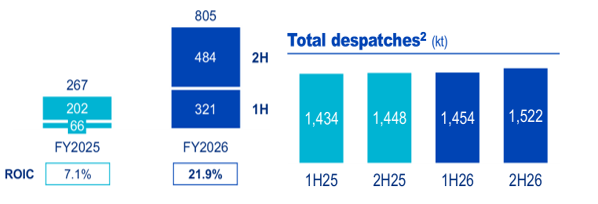
The FY26 result strengthened that thesis. BlueScope delivered underlying EBIT of $1.27 billion, up 73%, and underlying NPAT of $851 million, more than double FY25. Nowhere was the change clearer than North Star (see figure below). Steel despatches increased only 3%, from 2.88mt to 2.98mt, but EBIT jumped from $267 million to $805 million. That equates to roughly $270 of EBIT per tonne versus $93 a year earlier. Better US steel spreads, rather than dramatically more production, transformed the economics of an already excellent asset.
The brilliant North Star asset generated a ROIC (Return on Invested Capital) of more than 20 per cent.
Figure 3: North Star Profitability Underling EBIT – 1H & 2H vs 2025 – plus Volumes (dispatches)
Source: Bluescope FY26 Company Presentation
The broader result also contained encouraging improvements. North American Buildings and Coated Products (BCP) generated $230 million of EBIT, with Coated Products and Steelscape improving during the second half. Southeast Asia produced a record $157 million. The BCP position was part of BlueScope that we were initially attracted to, but the management team has been less positive about it over the past 18 months. We see additional value in this part of the business.
The weak point remains Australia, where EBIT fell 28% to $188 million — reinforcing our view that SGH could have brought a different operating and capital-allocation discipline.
Our disappointment is that it took a takeover bid to produce a much broader approach to shareholder value. BlueScope has now completed its $200 million cost program, is targeting at least another $150 million of benefits in FY27, is accelerating surplus land realisation and has materially lifted distributions. It will complete $3 per share of shareholder returns in CY26 and plans another $3 in CY27.
We sold around half our position at elevated prices around the bid, but BlueScope remains a large holding. We still believe these assets would be better run in the hands of the proposed suitors. The risk now is that the urgency fades as the takeover threat recedes. Against that sits genuinely better operating conditions and a small residual possibility of renewed corporate activity.
In keeping with the broader theme of Investment Matters this week, it remains disappointing how often value that appears transparent to trade buyers and private capital requires an external bid before Australian boards and markets begin seriously trying to unlock it. FY26 showed just how much value was there all along.
Seek Limited– Full year FY26 Results
AI, margins and the value of a placement
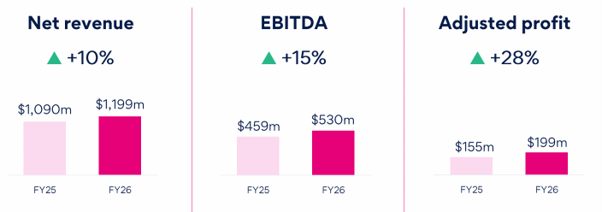
SEEK’s FY26 result was solid, but FY27 guidance disappointed. Revenue rose 10%, EBITDA 15% and adjusted profit 28%, with the EBITDA margin improving from 42% to 44%. At the midpoint of FY27 guidance, however, revenue growth slows to around 5%, EBITDA to 6% and adjusted profit to 3%.
Figure 4: Seek’s growth credentials remain. Revenue growth drives even faster growth in operating income and adjusted profit.
Source: Seek FY26 Company Presentation
There was nevertheless an important positive for our investment thesis. Cost control remains the missing link at SEEK. We have long believed that the economics of its dominant marketplace should support materially higher margins, with excess staffing and poorly directed investment depressing earnings. Encouragingly, margins and operating leverage are now much closer to the centre of management’s thinking. CEO Matt Narev said SEEK has “a really good handle on costs and the impact on operating leverage” and has become more selective about investment: “We know which investment works. We do more of that, less than the other stuff.”
Management is now targeting moderate growth in total costs, including both operating and capital expenditure. AI should assist. More than 75% of SEEK’s code is now produced with AI assistance and management says development throughput has increased by more than 40%. Faster and cheaper development should reduce the need for some of the staffing and accumulated technology expenditure that has weighed on margins. It is also shortening the useful life of older software, leading SEEK to retire products and reassess depreciation periods.
We still believe a stronger management team could have extracted these efficiencies and the benefits of platform unification more quickly. That is our judgement, rather than management’s claim. But the direction of travel is encouraging.
More importantly, AI strengthens what SEEK actually does.
SEEK is not simply a job board selling advertisements. It connects firms with potential employees and increasingly provides the tools required to complete the hiring process: identifying suitable candidates, ranking applicants, understanding hirer preferences, pre-screening candidates, conducting reference checks and recommending the next action.
The economic opportunity is to move from being paid primarily for listing a vacancy towards being rewarded for successfully filling it.
This distinction becomes more valuable in an AI world. Generative AI makes it easier for candidates to produce résumés and submit large numbers of applications. Employers do not need more applicants. They need fewer, better applicants and a faster route to a successful hire.
A simple competitor can access the same AI models. It cannot easily replicate SEEK’s candidate profiles, employer relationships, behavioural data and history of actual hiring outcomes. If AI improves SEEK’s ability to identify the right candidate, rather than simply generating more applications, it should strengthen, not weaken, the marketplace advantage.
We believe SEEK remains worth $22–$25 per share, with additional upside if capital currently tied up in its investment funds can be released in the short term. The result did not remove our concerns about execution or costs, but it provided further evidence that management is beginning to address them while AI expands both the efficiency and potential value of the core marketplace.
There are, however, risks, especially from AI and new competitors, and hence our position is only 2% of the Australian equity portfolio. We would look forward to increasing our position if the business demonstrated further cost control.
In a week in which Cleanaway and Reliance attracted bids for long-term strategic assets amid short-term earnings weakness, SEEK remains another classic example of the mismatch between near-term challenges and long-term strategic value.
Origin Energy– Full year FY26 Results
Origin Energy — strategic value is becoming clearer
Origin produced another strong result, but the strategic developments were more important than the headline profit. Our meeting with management this week consolidated our view that Origin is well placed to grow shareholder value.
Five issues stood out:
- Batteries are beginning to demonstrate their earnings power. Origin expects electricity gross profit to remain unusually strong even as wholesale electricity prices moderate.
- The strategic value of Origin’s existing assets continues to increase. Flexible generation, batteries, a large retail book and gas supply become more valuable as coal generation exits and replacement generation becomes more expensive to build.
- Costs and execution continue to improve. The $100–150 million cost-out target has been delivered, batteries have been commissioned on time and on budget, and customer growth has continued.
- Kraken and Octopus provide substantial additional value. Kraken now has an observable external valuation worth about $1.70 per Origin share, while Octopus continues to scale its increasingly valuable international retail operations.
- Strong cash generation is rapidly improving the balance sheet. Falling investment expenditure should provide Origin with materially greater capital flexibility over the next several years.
These developments support Origin remaining one of the largest positions in clients’ portfolios.
The information in this article is of a general nature and does not take into consideration your personal objectives, financial situation or needs. Before acting on any of this information, you should consider whether it is appropriate for your personal circumstances and seek personal financial advice.
Batteries change the electricity equation
The most important number in the domestic result was electricity gross profit of $45.20/MWh, up from $40.70/MWh and well above Origin’s medium-term target range of $25–$40/MWh.
Some moderation is inevitable. Lower wholesale electricity prices ultimately flow through into customer tariffs. Origin expects this to become more visible in FY28.
But FY27 is considerably more interesting.
Origin expects electricity gross profit to remain above its medium-term range, with the increasing contribution from its battery portfolio offsetting lower wholesale prices. Energy Markets EBITDA guidance of $1.55–$1.85 billion has a midpoint that is broadly equal to the very strong FY26 result and is above market expectations.
This is important for our investment thesis. Origin is becoming less dependent on high wholesale electricity prices alone.
Ian Myles of Macquarie pushed management on precisely this issue. Capacity prices have fallen, battery arbitrage spreads have narrowed, and FCAS prices have declined. Management acknowledged those movements but noted that much of FY27 is already reflected in tariffs and contracting. More importantly, the longer-term electricity system still needs to absorb approximately 20GW of coal closures while accommodating very substantial growth in demand. Flexible capacity should remain valuable in such a system. We agree.
Slightly lower electricity prices are therefore not necessarily a poor outcome for Origin. In the near term, lower procurement costs can support margins before tariff resets occur. Longer-term, lower prices will reduce retail gross profit, but they will also make new-generation projects harder to justify. This further increases the strategic value of Origin’s portfolio.
Yanco Delta illustrates the point. Falling wholesale prices combined with elevated construction costs have weakened the economics of a new 1.5GW wind farm. Origin can choose not to invest unless adequate returns are available. Meanwhile, its existing flexible assets become increasingly difficult to replicate.
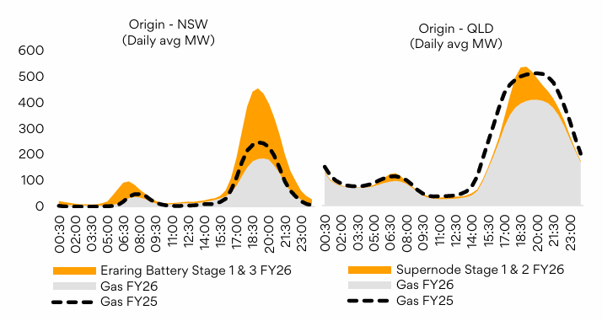
For the engineering-minded readers, we can see the role of batteries in replacing some of the gas-fired power generation in the Origin system between FY25 and FY26/ The chart shows the evening peak in NSW and QLD, and how in FY26 the Eraring battery in NSW and the Supernode battery in QLD replaced part (Qld) and all (NSW) of the reduction in gas-fired electricity deployed in FY25 (dotted-line).
Figure 5: Role of batteries
Source: Origin FY26 Company Presentation
Scarcity value is increasing
This is the broader strategic attraction.
Origin owns the country’s largest energy retail position, Eraring, gas-fired generation, an increasingly substantial battery fleet and 27.5% of APLNG. Its batteries are being integrated with the retail load rather than developed as isolated merchant assets.
As of August, 1.3GW and 4.1GWh of Origin’s planned 1.8GW battery portfolio was already operational. Importantly, management describes the program as on time and on budget.
As replacement generation becomes more expensive, planning becomes more difficult, and coal capacity exits, the strategic value of an existing portfolio capable of supplying, storing and managing electricity should increase.
Better execution, lower capital intensity
Cost performance also continues to improve.
Origin has delivered $126 million of savings against its FY24 cost base, while simultaneously adding 243,000 customer accounts including acquisitions. This is evidence of better operating leverage rather than simply cost reduction through contraction.
The capital expenditure profile is also changing dramatically.
Origin spent $1.47 billion in FY25 and $969 million in FY26. FY27 guidance is only $450–$650 million, with the remaining battery expenditure progressively rolling away.
That is a significant cash-flow inflection.
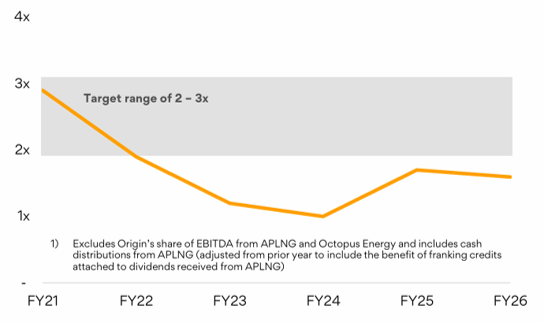
Adjusted free cash flow reached $2.07 billion in FY26, while adjusted net debt to EBITDA fell to 1.6 times, below Origin’s 2–3 times target range.
Figure 6: Debt levels – below target range Adjusted Net Debt / Underlying EBITDA
Source: Origin FY26 Company Presentation
The combination of strong underlying cash generation and materially lower capital expenditure gives Origin considerable optionality: acquisitions, additional flexible generation where returns justify it, investment in new customer propositions, higher shareholder returns, or simply a stronger balance sheet.
Kraken and Octopus — around $2.60–$2.90 per share
As we noted in January following a series of deals completed by Origin and its partners, the offshore investments are also becoming easier to value.
Kraken has now formally separated from Octopus and completed its first standalone equity raising at US$8.65 billion. Origin retains a 22.7% economic interest, comprising direct ownership and its indirect interest through Octopus. At the transaction exchange rate, that stake is worth approximately A$2.9 billion, or A$1.70 per Origin share.
And Kraken continues to grow into that valuation.
Contracted accounts increased from 74 million to 95 million during FY26, live accounts reached 52 million, and revenue increased 19% to £300 million. Contracted annual recurring revenue increased 44%, subscription gross margins were 75%, and management expects revenue growth above 20% in FY27.
Octopus should not be forgotten in the excitement around Kraken.
It now has approximately 19 million customer accounts, including 14.8 million in the UK. UK Retail generated £39 EBITDA per customer in FY26 and has now produced four consecutive profitable years. The international business added 1.4 million accounts during the year, while investment in Energy Services is moderating as the business approaches break-even.
We believe approximately $0.90–$1.20 per Origin share is a reasonable current value for Origin’s interest in Octopus excluding the Kraken value already counted above.
Combined, Kraken and Octopus are therefore worth roughly $2.60–$2.90 per Origin share, according to our estimates, with considerable scope for further growth.
From a portfolio perspective, 20 per cent of the value of Origin is a technology play, adding growth to the portfolio alongside an excellent dividend, strategic assets, and strong operations.
That is a substantial amount of value inside an Origin share before attributing anything to the domestic Energy Markets business or APLNG.
The FY26 result therefore reinforced rather than changed our investment thesis. Batteries are beginning to replace some of the earnings previously provided by unusually high electricity prices. Costs are falling. Execution is improving. Capital expenditure is declining sharply. Cash generation is strengthening the balance sheet. And Kraken and Octopus continue to build significant value outside the Australian business.
At the same time, the difficulty and cost of constructing new generation is increasing the strategic value of the assets Origin already owns. Taken together, these characteristics support Origin’s remaining one of the largest positions in clients’ portfolios.
Estimated reading time: 24 minutes