
Estimated reading time: 16 minutes
Copyright 2026 First Samuel Limited
This week in Investment Matters
- The Commonwealth Bank’s reporting pack reveals insights into the Australian economy, particularly in home and business lending.
- CBA has a significant focus on home loans, which raises concerns about capital misallocation toward residential property.
- Current lending conditions prompt CBA to discuss directing capital to businesses, amidst falling mortgage applications and economic slowdown.
- The takeover proposal for Cleanaway Waste Management highlights the trend of value transfer from local fund managers to strategic investors.
- Investment Matters will cover key portfolio companies during reporting season and highlight share price movements and market reactions.
Read the previous Investment Matters here
The market
Information-rich CBA
August is information-rich. Company profit reporting season offers an unusually concentrated opportunity to learn about companies, industries, and the economy itself. The numbers matter, but often the most useful information lies beneath them: what customers are doing, where credit is flowing, what businesses are investing in, where costs are rising, and sometimes what companies inadvertently tell us about the economy they have helped create.
Which is why we can admit to finding the almost 140-page Commonwealth Bank reporting pack genuinely exciting reading. CBA touches such a large part of the Australian economy that its results provide an extraordinary window into households, housing, deposits, business conditions and credit.
They also provide an insight into one of Australia’s longstanding economic problems.
CBA is, at its core, an extremely large building society. In June, it had approximately $636bn in home loans against $275bn in total business lending. It controls around one-quarter of Australia’s mortgage market. CBA has not merely observed Australia’s extraordinary misallocation of capital towards residential property; it has been one of its principal beneficiaries and facilitators.
That makes comments from CEO Matt Comyn this week particularly interesting. Comyn emphasised that business lending supports investment, employment and productive capacity, noting that CBA’s business lending has more than doubled over the past decade (+>$120bn) while home lending has grown by around two-thirds (+>$250bn).
On a dollar basis, CBA has still lent twice as much to Australians buying houses from each other as to businesses that employ the mortgage holders.

We agree with Comyn’s diagnosis on productivity and wealth creation. We are less inclined to congratulate CBA for discovering it in 2026.
The problem with home lending
For decades, Australia’s banking system has found lending against existing houses extraordinarily attractive. Regulation, capital treatment, tax policy and steadily rising property prices reinforced the economics. The result was an enormous expansion of mortgage credit and bank balance sheets without anything like the equivalent expansion in productive business investment. CBA became exceptionally good at this model.
Current conditions, however, provide an interesting backdrop to Comyn’s shift in focus. Mortgage applications have fallen sharply, particularly from investors. Housing credit growth is expected to slow. Economic growth is weakening. So, when Australia’s largest bank begins talking more loudly about directing capital towards businesses, investment and productive capacity, we pay attention. Not because CBA has suddenly solved Australia’s capital-allocation problem, but because one of the institutions that prospered most from the old model appears to recognise that the next decade cannot simply be another exercise in expanding mortgage balance sheets against increasingly expensive houses.
The challenge for CBA as one of the world’s most expensive banks is that it isn’t priced for business lending (much lower multiples) nor does it have the pedigree or institutional capacity to switch overnight. Does anyone remember Ian Johns?
That is precisely why August is information rich. A bank result can tell us much more than profits.
*****BREAKING NEWS*******

Just as we were completing Investment Matters, Cleanaway Waste Management — currently our largest portfolio position — announced that it had received a takeover proposal from EQT Infrastructure.
EQT has offered $3.13 cash per share, valuing Cleanaway at approximately $9.4bn including debt. That represents a 32% premium to Wednesday’s closing price. Cleanaway has granted EQT nine weeks of exclusive due diligence and, subject to a binding agreement at no less than $3.13 per share, the Board intends to recommend the transaction in the absence of a superior proposal. The structure may also allow Cleanaway to distribute additional value through a fully franked special dividend.
We believe the bid undervalues the business; our valuation is $3.35 per share, and an acquirer should pay a premium for control on top of that. There is a possibility the offer will attract additional bids from other acquirers.
The identity of the current bidder makes sense. EQT is a large global investment group with €291 billion of assets under management and a substantial infrastructure business. Environmental services are a specific area of expertise, with prior investments in waste collection, treatment, recycling, and waste-to-energy businesses. Cleanaway’s irreplaceable collection network, transfer stations, landfills and processing infrastructure fit naturally within that strategy.
As clients would know, takeovers are also an important part of how we generate investment returns. Our investment process deliberately seeks businesses that own strategic assets whose value may be greater to an informed industry or infrastructure owner than is sometimes reflected in the listed market price. We don’t buy companies because we expect them to be taken over, but strategic value offers another potential pathway for that value to be realised.
Excellent analyst Hasan Tevfik from MST Marquee summed up the broader trend well:
“The bid for Cleanaway this morning could mark yet another transfer of value from Australian fund managers to ‘real-world’ investors. The local market’s fixation with earnings momentum means companies delivering it are often richly valued, while those that are not can trade much more cheaply, even when they own valuable strategic assets.”
That observation is particularly relevant to Cleanaway. Recent earnings disappointments changed the market’s view of near-term earnings momentum. They did not make Australia’s largest waste infrastructure network any less strategic.

At this stage the proposal remains conditional and non-binding. We will have considerably more to say once Cleanaway reports its FY26 result next week.
This week’s results
This week marks the second week of reporting season.
As in previous seasons, Investment Matters will include a table covering every portfolio company that reports. This year we are expanding it to include selected companies we do not own but which remain important to understanding the broader market. The table will clearly distinguish between companies we own and those we do not.
We are also adding two measures of share-price performance: the movement in the lead-up to the result, and the movement from results day through to the close yesterday, Thursday 13 August.
That distinction has become increasingly important.
Results-day volatility has risen sharply in recent reporting seasons. At the same time, positioning ahead of results has become more extreme. By positioning, we mean not simply whether investors are positive or negative on a company, but how much of that view is already embedded in portfolios and share prices. A company can enter reporting season after a substantial rally, with investors heavily overweight and expectations unusually high. Another can arrive deeply out of favour, widely under-owned and with very little expected of it.
The result itself is therefore only part of the story. A good result can produce a falling share price if investors were positioned for something better. An apparently ordinary result can produce a large rally when expectations and positioning were sufficiently depressed. Looking at both the lead-up and the subsequent reaction gives a much better picture of what the market is telling us.
We will include all reporting portfolio companies in the table, but we will not discuss every result in detail during the week it is released. As in previous years, we expect to return to a number of these companies in Investment Matters during September, once the immediate noise of reporting season has subsided.
This week we focus on Integral Diagnostics, SEEK Limited, James Hardie and SGH.
| Company | Event & Market Reaction since Result | Commentary |
|---|---|---|
| James Hardie (JHX) POSITIVE | 3Q Update 7th August Movement since June 30 2026: 6.9% Movement post result: +7.6% | Market update surpassed already upgraded guidance for EBITDA. Better execution and emerging synergies from the poorly executed AZEK merger (March 2025) are emerging. The AZEK merger, which saw the share price fall more than 40%, created an entry point for our ownership. Returning more than 55% since, the company still provides upside to the US housing cycle and is a valuable technology-forward manufacturing company. |
| Integral Diagnostic (IDX) POSITIVE | Update: Monday 10th August Movement since June 30: +9% Movement post result: +3.8% | IDX pre-announced their FY26 result at the same time as announcing the appointment of a new CFO. See detailed report |
| SGH Group (SGH) NEUTRAL | FY26 Results 13th August Movement before: +20% from May 26 low point Movement post result: -10.7% | See detailed report. |
| Amcor (AMC) NEUTRAL | FY26 Results 13th August Movement before: +30% from May 26 low point Movement since: -1.6% | Pleasing result from the $75bn global packaging company. Amcor delivered an encouraging result overnight despite a still-challenging packaging environment. Volumes finally returned to modest growth (+0.5%). In terms of our thesis, execution on the Berry acquisition remains excellent, ahead of the original first-year target. Cash flow disappointed, but largely because of the Iran War. Amcor remains cheap in a difficult sector, but execution is improving, and we see considerable upside from current levels. |
| Life360 (360) NEUTRAL | FY26 Results 13th August Movement since May 31: 50% Movement post result: -19.7% | See detailed report. |
| Seek Limited (SEK) POSITIVE | FY26 Results 13th August Movement before: +19% Movement post result: -8.8% | The stock price rose sharply in the results, but disappointed on FY27 profit expectations, reversing the gains. That wasn’t our take; we were pleased management focus on total cost growth, how they drove AI investment through productivity, and their views on rapidly increasing product deployment. Seek communicated its future in an AI world more clearly than ever before. For all businesses, knowing your product is core. “When we sell or hire a job ad, what we’re really selling them is a pool of candidates that we’re going to deliver and some support services to get to that placement really quickly. We are evolving away from a job ad towards more selling you the outcome.” This augurs well for a more profitable AI driven future. More in next week’s Investment Matters. |
| Origin Energy (ORG) POSITIVE | FY26 Results 13th August Movement since June 30: +2.6% Movement post result: +6.1 | Fabulous result. Strong cash flow, and guidance demonstrated the strength of its energy markets business. Structurally well placed in a changing energy market and the benefit of higher electricity demand in the long-term. Franked dividend support (5.3%) and upside towards our valuation. |
| HomeCo Daily Need REIT (HDN) NEUTRAL | FY26 Results 13th August Movement since June 30: -0.4% = Movement post result: -9.1% | Performing in line with expectations. Strong occupancy, rent collections, operating income growth, leasing spreads and accretive debt refinancing. Only negative is pausing development and slightly weaker FY27 guidance. Valuation intact, short-term growth a little softer. |
| Insurance Australia Group Limited (IAG) | FY26 Results Movement since June 30: +1.7% Movement post result: -1.9% | IAG is a position in Conservative portfolios and has worked well over many years. FY26 results were slightly disappointing, and the FY27 outlook was cautious and messy. Structurally, IAG has done a great job managing insurance margins, weather risks and integrating many businesses well. But deterioration in NZ and complications with profit commissions highlight that variation in earnings remains ever present. |
| Orora Limited (ORA) POSITIVE | FY26 Results Movement since June 30: +1.7% Movement post result: -1.9% | We see value in Orora at a level more than 40 per cent above the current level. Significantly impacted by the Iran War (operations in the UAE), FY26 has been a tough year, and conditions remain challenging. But priced at 14x earnings, and a 6% yield, this is more than reflected in the current price. Asset realisation and corporate appeal, along with improving operations, all add upside. |
| NOT OWNED BUT OF INTEREST | ||
| Commonwealth Bank (CBA) | FY26 Results Movement since June 30: +5.6% Movement post result: -3.7% | The operating result was reasonable, but a tough outlook and the wrong share price make CBA amongst the most overpriced stocks in the market. CBA is the most leveraged bank to housing and deposits. Federal budget changes may mark a structural decline in the demand for home loans, with application trends persistently negative. Loans create deposits. This scenario has materially negative consequences for bank revenue growth (volume and margin on both the asset and liability sides of the balance sheet). Fewer loans, fewer deposits and more competition don’t bode well for margins and profits going forward. |
Integral Diagnostics (IDX) – Preliminary FY26 and new CFO
Promising set-up, ready to launch.
Integral Diagnostics, an Australian shares sub-portfolio, announced preliminary profits and the appointment of a new CFO, Ms Jenny Martin, an experienced executive with recent history in healthcare software and technology. Ms Martin will be joining Mr Jason Martinez, who brings 20 years’ experience in diagnostic imaging, health and medical sectors. Mr Martinez commenced in early August.
The company had its first full year of incorporating the acquisition of Capitol Health (CAJ), which significantly bulked up the business and provides lucrative synergy opportunities. The revenue printed at close to expectations, with some market disappointment around referral numbers not growing in line with Medicare benefits and Bulk Billing incentives.
But the pathway through rests on four concrete, identifiable levers:
- Capitol Health (CAJ) cost synergies are annualising on schedule. Despite the revenue miss, operating EBITDA margin still hit guidance at ~21%, up 80bps on pcp — evidence the cost-out program is doing its job even as top-line momentum disappoints.
- Teleradiology at CAJ has real runway. Management’s stated target is to lift CAJ’s teleradiology usage to ~20%, in line with IDX’s own pre-merger rate, up from roughly 7% today. Closing that gap is a direct lever on labour cost efficiency and capacity utilisation, independent of volume recovery.
- MRI deregulation and CT lung cancer screening remain structural, not cyclical, tailwinds. Both support an ongoing mix shift toward higher-fee imaging modalities — the timing of GP referral pattern adoption may be slower than modelled, but the regulatory settings themselves haven’t changed.
- Margin trajectory still points up. We expect margin expansion to continually ramp as CAJ synergies mature and cost inflation (particularly labour) moderates.
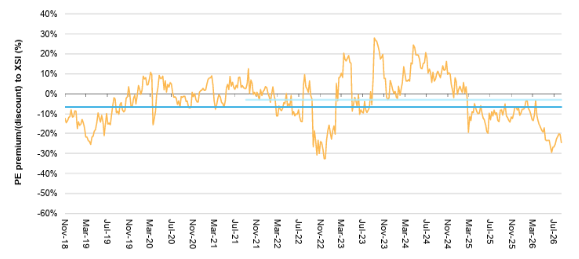
Combined with falling leverage (2.3x and improving) and a valuation sitting at a 25% discount to the Small Ordinaries Industrials, the setup increasingly looks like a business proving its integration thesis in a lower-expectation environment — which is often when the risk/reward turns in the patient investor’s favour.
Figure #: IDX PE Discount to the market is now -25% (i.e cheap) versus 10 yr average of 6%
Source: Macquarie Research, FactSet
Life360 (360) – 2Q FY26 Results
Life360 was a perfect example of why positioning matters during reporting season.
The shares rose 38 per cent in June and another 15 per cent in August before the result. That momentum was not simply a response to improving fundamentals. Third-party Sensor Tower data had encouraged expectations that monthly active user growth was already reaccelerating after the temporary Android onboarding problems earlier in the year. Investors became increasingly focused on an extremely short-term question: exactly how quickly was user growth improving?
The result did not quite satisfy that positioning.
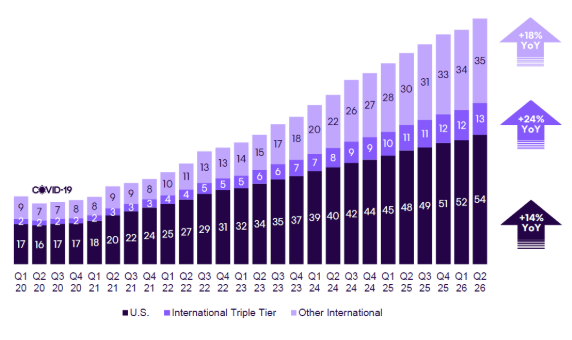
Global monthly active users reached 102.4 million, with 4.6 million users added during the quarter. But annual growth slowed slightly to 16.2 per cent from 16.7 per cent in the March quarter, remaining below Life360’s 17–20 per cent full-year target. Management said growth improved through the quarter and exited June back on its planned trajectory, with international initiatives and the important US back-to-school period expected to drive acceleration during the second half.
Figure #: Life360 Core Monthly Active Users (MAU) since 2020
Source: Q2 FY26 Company Presentation
Markets are understandably wary when guidance requires sequential improvement. The mathematics now require Life360’s user growth to accelerate during the remainder of the year. That creates a short-term proof point and helps explain why a heavily positioned stock could fall more than 20 per cent despite an otherwise strong result.
But this focus also risks confusing the measurement with the economics.
Life360 already has more than 100 million monthly active users and 3.2 million Paying Circles. The important long-term questions are increasingly how effectively that network can be monetised, how far paid penetration can rise internationally, and what additional products can be distributed across it. A movement of half a percentage point in annual MAU growth matters, but it is not remotely the whole investment case.
On the fundamentals, we were pleased.
Paying Circles reached 3.2 million, ahead of expectations, while subscription revenue increased strongly enough for management to lift FY26 subscription revenue guidance to US$475–480 million. Adjusted EBITDA margins were also materially ahead of market expectations. These results reinforce the long-term subscriber growth shown in the accompanying chart and demonstrate that conversion and monetisation remain healthy.
Advertising is becoming increasingly important. Revenue from advertising grew more than 300 per cent, while management continues to expect fourth-quarter advertising revenue to be around twice the level achieved in the first quarter. The integration of Nativo is moving the business from experimentation towards genuine commercial scale, while early testing using Life360’s first-party data has produced materially better engagement. The opportunity is significant because it allows Life360 to monetise a very large user base without requiring those users to become paying subscribers.
International monetisation provides another substantial runway. International subscription revenue grew 45 per cent, while markets including Brazil and Mexico remain at relatively low levels of paid penetration. Again, the opportunity is not simply to add users, but to monetise an existing and growing network more effectively over time.
Our portfolio positioning reflects the same distinction between price and fundamentals. We substantially reduced our holding when the shares traded through the $40–$50 range in late 2025 and have recently been adding again at lower prices.
At current levels, our valuation of Life360’s existing operations alone provides substantial support for the share price. That valuation gives little credit to either new product development or the emerging advertising business. Both received further support from this week’s operating result.
The market wanted faster monthly active user growth. We saw considerably more information than that.
The information in this article is of a general nature and does not take into consideration your personal objectives, financial situation or needs. Before acting on any of this information, you should consider whether it is appropriate for your personal circumstances and seek personal financial advice.
Estimated reading time: 16 minutes