

The market
FYTD: ASX and Wall Street
Oct 2026 (MTD) · Australia +1.85% · US +2.94%
Source: IRESS · 30 October 2026. View original chart ↗
View chart data
| Period | Australia: ASX/S&P 300 | US: S&P 500 |
|---|---|---|
| Jun 2026 | 0.00% | 0.00% |
| Jul 2026 | +2.12% | -0.13% |
| Aug 2026 | +3.33% | +2.49% |
| Sep 2026 | +0.05% | +2.03% |
| Oct 2026 (MTD) | +1.85% | +2.94% |
The week: ASX and Wall Street
Week · Australia +2.01% · US +0.74%
Source: IRESS · 30 October 2026. View original chart ↗
View chart data
| Period | Australia: ASX/S&P 300 | US: S&P 500 |
|---|---|---|
| Mon | +0.18% | -0.52% |
| Tue | +0.49% | +0.70% |
| Wed | +0.01% | +0.60% |
| Thu | +0.49% | +0.28% |
| Fri* | +0.82% | -0.30% |
| Week | +2.01% | +0.74% |
Good investment news, poor economic news
It has been an important news week for our portfolios, with developments ranging from persistent inflation and the prospect of further interest rate increases to strong operating results from several longstanding investments. BlueScope’s substantial earnings upgrade highlighted the value of its strategic industrial assets; Sandfire and Aurelia Metals demonstrated the benefits of improving operations and established mining infrastructure, while Woolworths delivered impressive sales growth, assisted by the return of its hugely successful Ooshies promotion.
There is a common thread. Australia’s economy continues to struggle with weak productivity, constrained supply, and considerable pricing power in key industries, while businesses compete increasingly aggressively for financially stretched households’ spending. These pressures have important implications for interest rates, company profitability, and equity valuations. This week’s results provide encouraging evidence of the value we’re creating in our portfolios, but they also reinforce why we remain selective about where we invest and how much capital we commit.
Inflation: The RBA confronts Australia’s structural problems
Australia’s latest inflation figures offer the Reserve Bank further uncomfortable reading. Annual headline inflation increased to 4.3% in September, while underlying trimmed-mean inflation remained elevated at 3.6%. More concerning is the persistence of the problem: quarterly trimmed-mean inflation has been outside the RBA’s target band for 17 of the past 21 quarters (5+ years!!).
And this quarterly inflation print wasn’t just driven by volatile elements such as Energy. As the excellent Jonathan McMenamin at Barrenjoey noted, and the chart below shows, “it’s important to recognise that a 1.0% Q-o-Q rise in underlying inflation (trimmed mean) is rare and exceptional”.
Underlying inflation (trimmed mean) spiked again
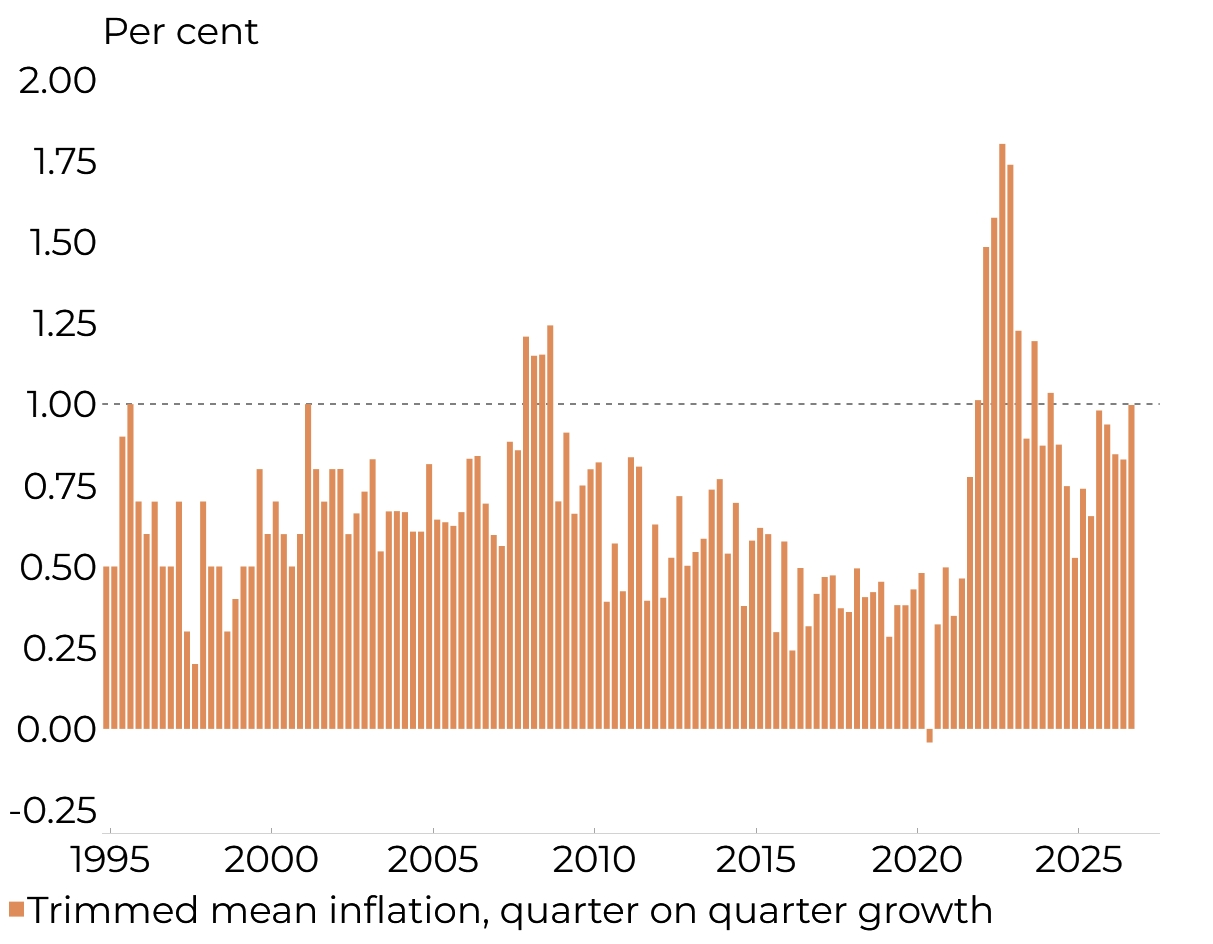
The figures increase pressure on the RBA to raise interest rates further – the probability of a November RBA rate rise has reached 80%. However, the most important development may not be the inflation figures themselves, but the Bank’s emerging recognition that the Australian economy is less capable of meeting demand without generating inflation than previously thought.
Last week, Deputy Governor Andrew Hauser confirmed that the RBA was reassessing its estimates of spare capacity, while Governor Michele Bullock acknowledged that the labour market appeared tighter than previously judged.
Central to this reassessment is the NAIRU (non-accelerating inflation rate of unemployment) — the estimated unemployment rate consistent with stable inflation. The RBA is examining whether this rate may be closer to 5%, rather than previous estimates around 4.5–4.6%.
In other words, Australia may need a higher unemployment rate to contain inflation than previously thought.
We are not surprised.
We have argued for years that Australia’s inflation problem is not simply excessive demand. Persistent non-tradables inflation reflects deeper weaknesses in the economy’s capacity to supply goods and services efficiently.
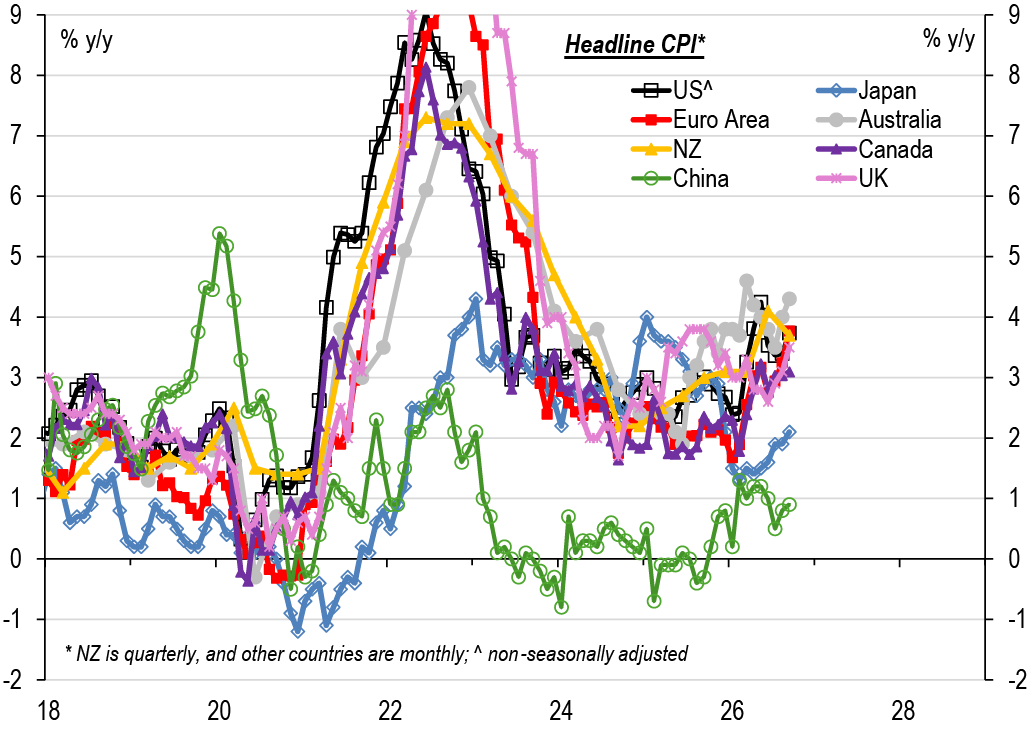
The net result is that at the headline level, Australian CPI is now, and arguably has been for 1-2 years, high by international standards as shown in the chart below (Australia in grey).
Headline CPI in Australia is high compared with global major economies
Good for equities, bad for the country
One consequence of persistent inflation is that businesses and consumers gradually adjust their expectations. Price increases that once required considerable justification become routine, and annual pricing decisions increasingly assume costs will keep rising.
For companies with strong competitive positions, this can be enormously valuable. Pricing power lets businesses pass through rising costs, capture the benefits of economic growth through higher prices, and, importantly, protect margins when economic conditions deteriorate. Higher profitability and more resilient earnings can justify substantially higher equity valuations.
We see evidence of the premium Australian investors attach to these characteristics in the valuations of Woolworths, Sigma Healthcare (Chemist Warehouse) and Wesfarmers (Bunnings). Each benefits from scale, established market positions, and competitive advantages that smaller businesses find difficult to replicate. Their valuations suggest the market understands the considerable value of these characteristics in Australia’s concentrated industries.
This does not necessarily explain sudden inflation spikes, although market concentration can influence how firms pass price increases on to consumers.
However, we believe limited competition and entrenched pricing power are critical to understanding inflation persistence and the formation of inflation expectations. Businesses with considerable pricing discretion can make price increases more enduring, while reducing competitive pressure to improve efficiency and productivity.
What is good for an individual company’s valuation is not necessarily good for the country’s productivity, competitiveness, or prosperity.
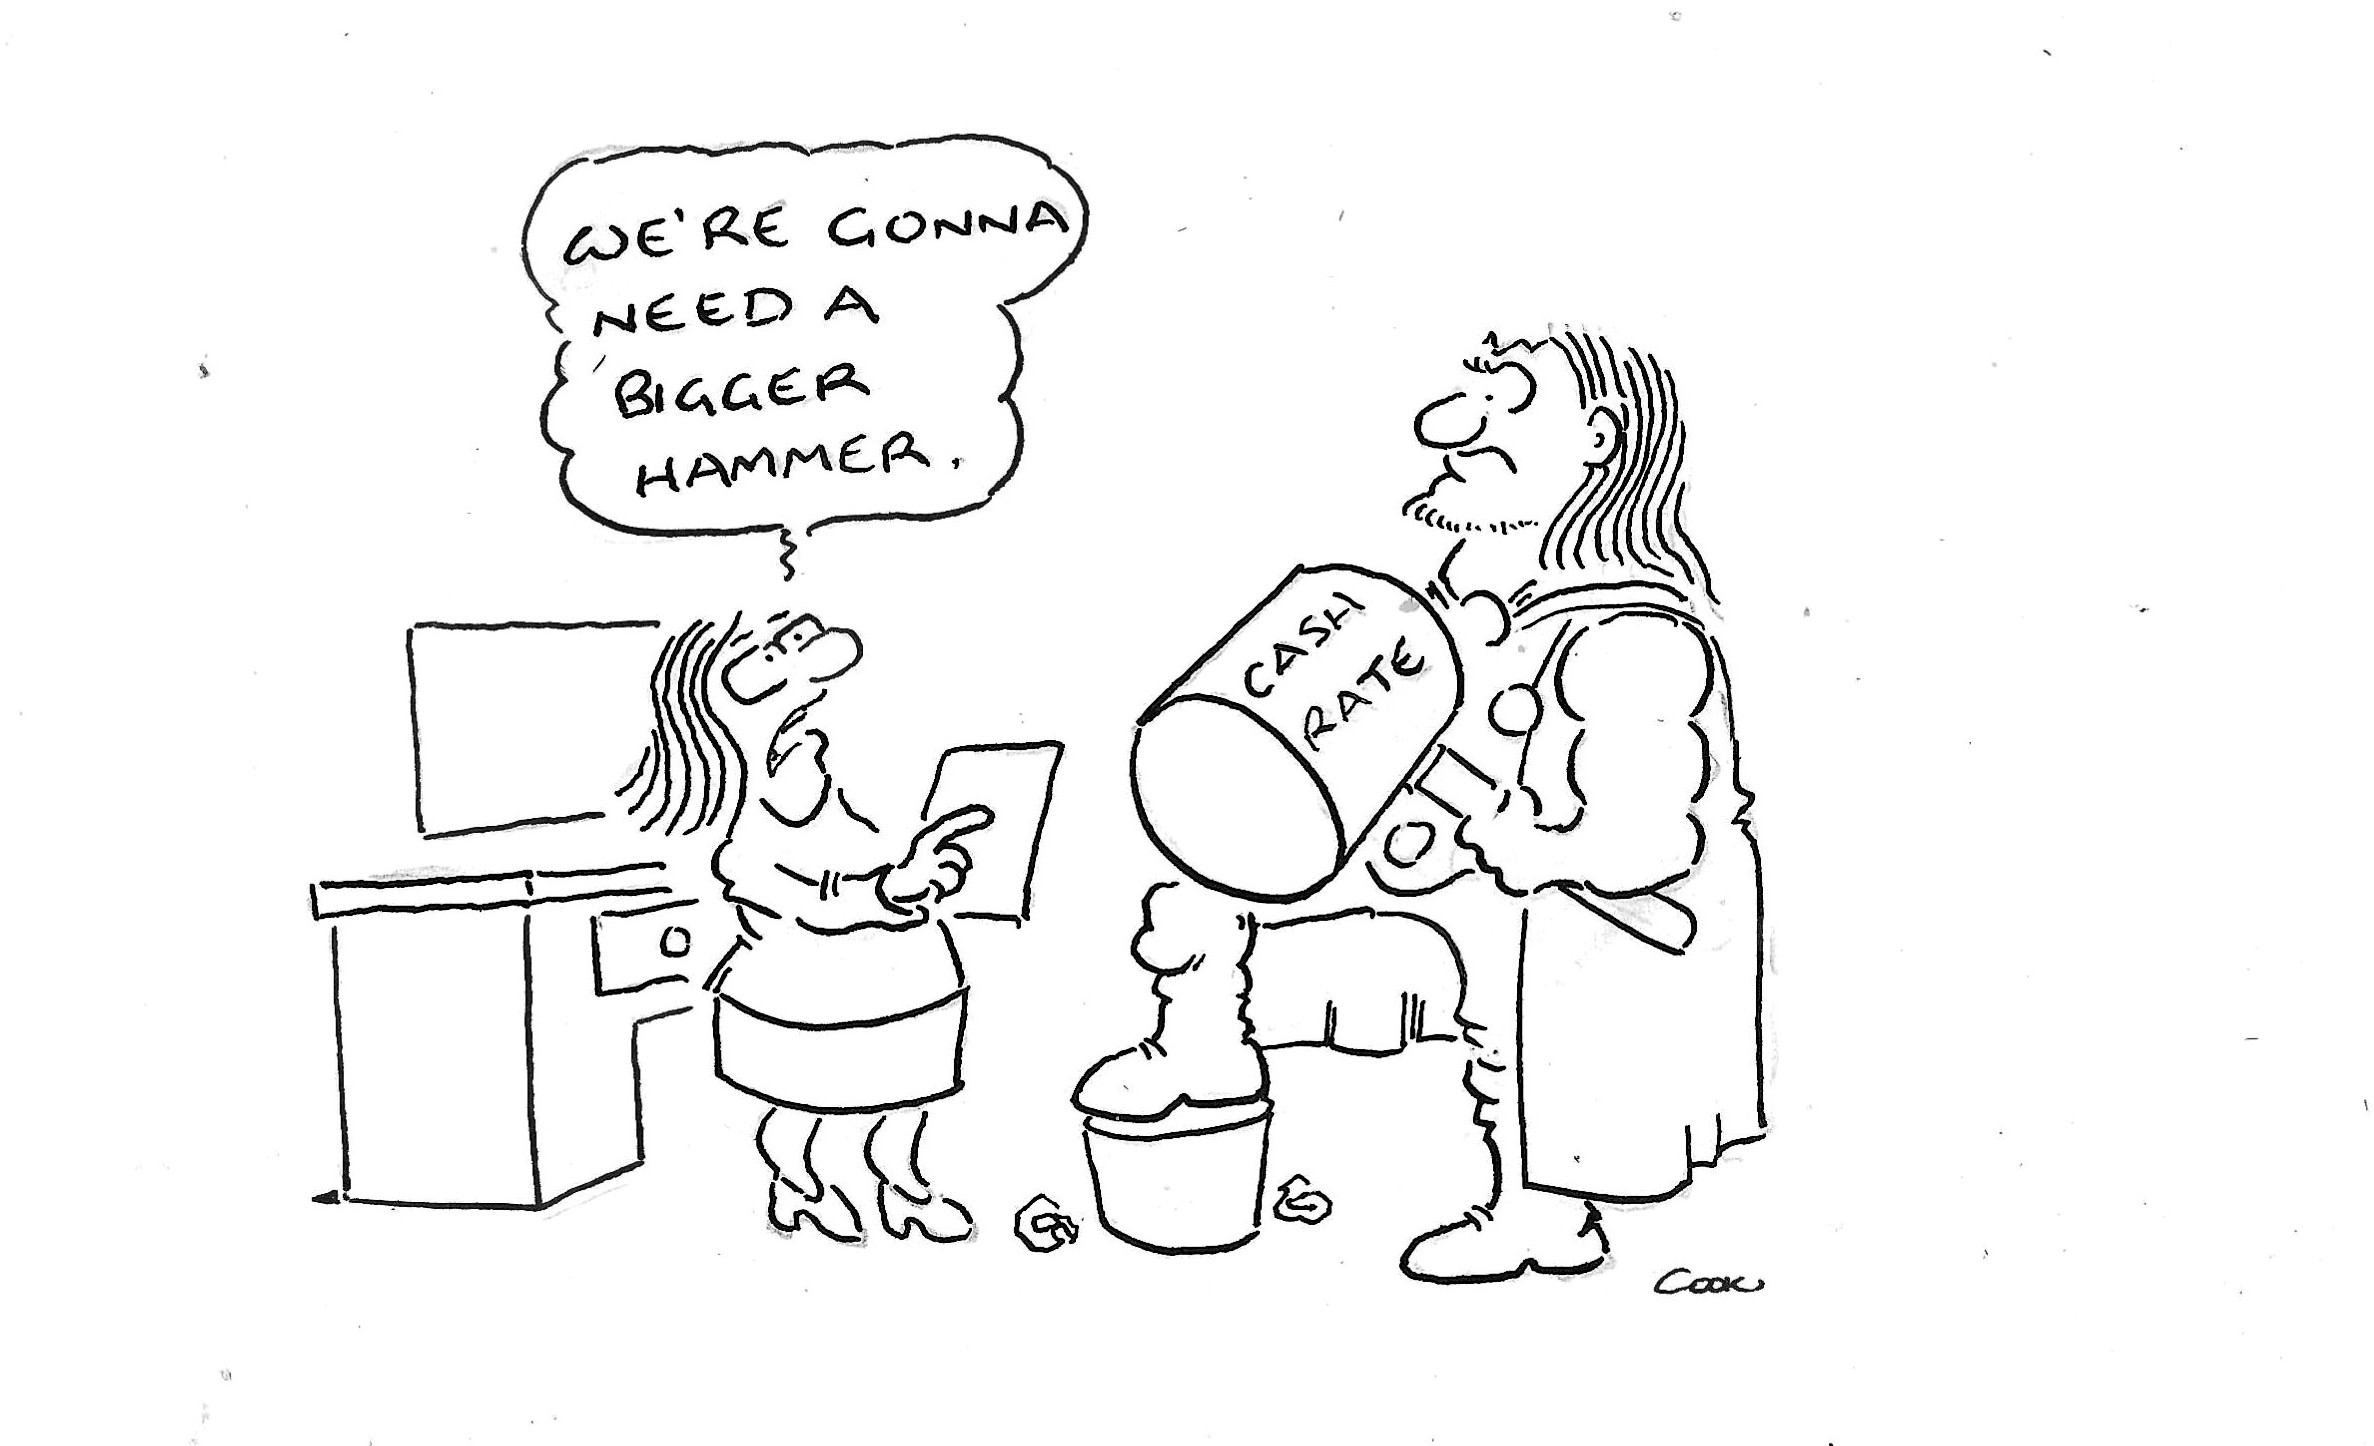
The RBA’s principal instrument, the cash rate, is remarkably blunt. Higher interest rates cannot directly restore productivity, improve competition, build additional housing, or ensure workers have the skills businesses require. Instead, monetary policy constrains demand until it matches the economy’s diminished capacity to supply goods and services.
These costs are distributed unevenly.
Portfolio implications: Caution is warranted
We believe the latest inflation figures and the RBA’s reassessment of the economy’s productive capacity make another two interest rate increases a realistic prospect. As monetary policy is increasingly asked to compensate for structural economic weaknesses, the risk of an overshoot is growing.
The portfolio implications are relatively straightforward. We see little reason to be fully invested in the Australian equity market, particularly given demanding valuations and the attractive returns currently available on cash.
We are especially cautious about businesses heavily exposed to the domestic economic cycle. Falling house prices, rising mortgage costs, and eventually weaker employment could put considerable pressure on household spending, corporate earnings, and bank credit quality.
We are concerned that falling house prices may precede rising unemployment, with higher bank bad debts emerging only later in the cycle. This makes the historically elevated valuations of Australian banks particularly difficult to justify.
There are important exceptions. We continue to favour infrastructure investment, particularly where long-term demand is underpinned by essential services, electrification and the need to expand productive capacity. We also favour businesses with genuine pricing power, strong balance sheets and the capacity to protect margins in a difficult economic environment.
BlueScope: Stronger earnings, improving outlook
BlueScope’s latest earnings upgrade was an excellent result for shareholders, confirming the substantial improvement in operating conditions across its businesses. The share price has been well supported over the past twelve months and is now trading above the effective price of the takeover proposal made earlier this year by SGH and US steel producer Steel Dynamics (SDI).
We have been pleased with this performance. BlueScope remains a substantial portfolio holding, although we sold approximately half our position at elevated prices around the takeover proposal.
The company upgraded expected underlying EBIT for the first half of FY27 to approximately $1.1bn, around 20% above the midpoint of previous guidance. Stronger US steel margins, along with higher production and better-than-expected performance in Australia and North America’s coated products businesses, drove the improvement.
We estimate full-year FY27 underlying EBITDA could reach $2.85bn, approximately 45% above FY26 and almost double FY25.
BlueScope Steel Underlying EBITDA since 2016
Underlying EBITDA · A$ million · Financial years
FY27 · A$2,850 million · First Samuel estimate
* FY27 is a First Samuel estimate, not company guidance.
View chart data
| Financial year | Underlying EBITDA | Basis |
|---|---|---|
| FY2016 | 963 | Historical |
| FY2017 | 1,484 | Historical |
| FY2018 | 1,645 | Historical |
| FY2019 | 1,761 | Historical |
| FY2020 | 1,099 | Historical |
| FY2021 | 2,212 | Historical |
| FY2022 | 4,337 | Historical |
| FY2023 | 2,266 | Historical |
| FY2024 | 2,026 | Historical |
| FY2025 | 1,452 | Historical |
| FY2026 | 1,966 | Historical |
| FY2027 | 2,850 | First Samuel estimate |
The chart highlights both the substantial recovery in earnings and the cyclical nature of the steel industry. FY27 earnings could be the strongest since the extraordinary conditions of FY22, notwithstanding the considerable investment undertaken in the intervening years.
North Star drives the recovery
The most important contributor has been North Star, BlueScope’s highly profitable US steelmaking operation in Ohio.
US steel margins have strengthened considerably, supported by import restrictions, relatively low inventories, extended delivery times and resilient underlying demand. BlueScope increased its assumed US mini mill spread (gross profit) for the current half from US$750 to US$810 per tonne, while recent spot spreads have approached US$925 per tonne.
While not a perfect indicator of the spreads achieved by BlueScope’s North Star, an Electric Arc plant that uses recycled steel as input, the following chart shows US Hot Rolled Coiled Steel pricing before costs. Coupled with strong demand the price rebound since mid-2025 is driving profits at North Star.
10 years of steel spreads in the US
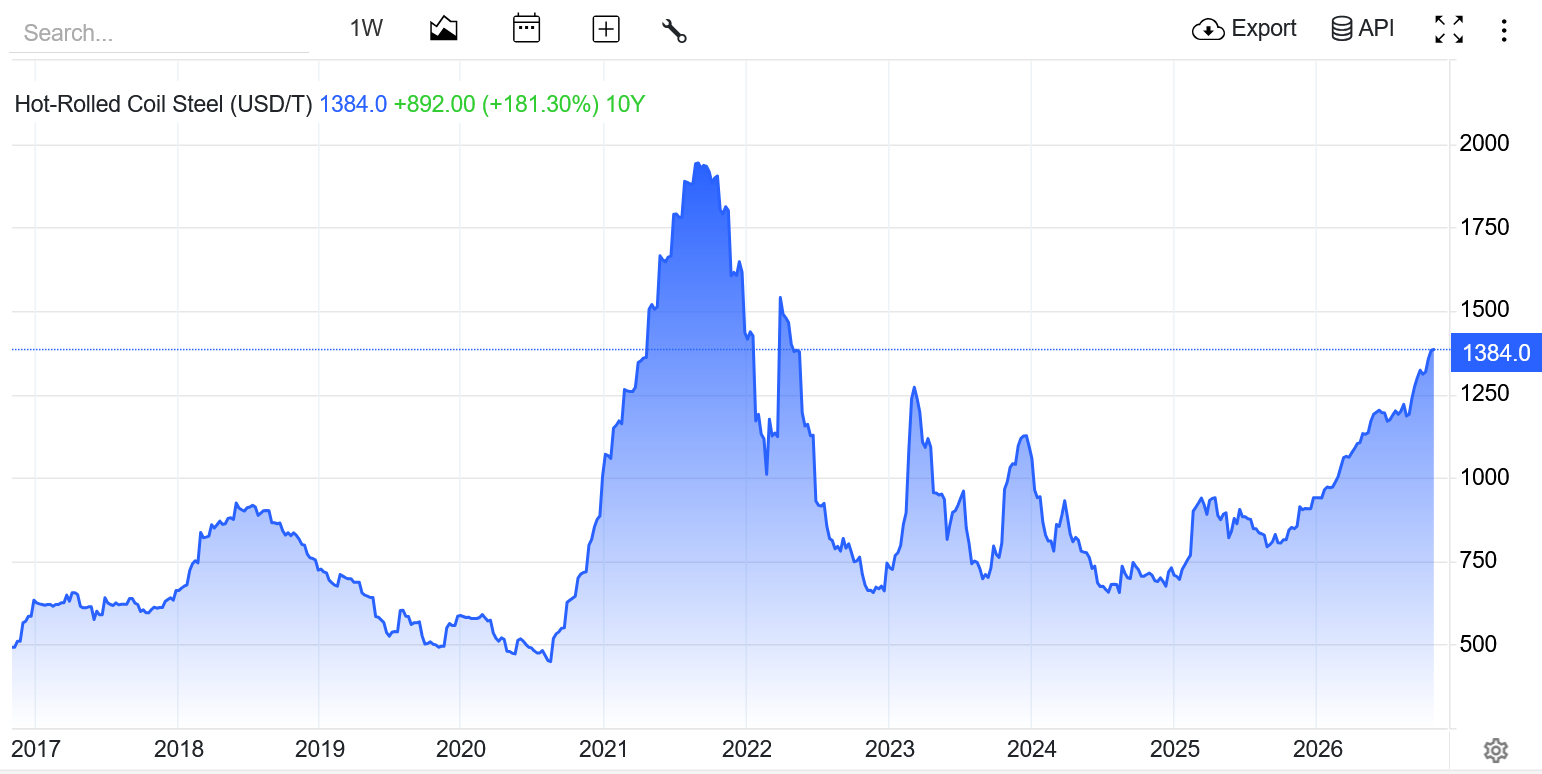
The sensitivity of North Star’s earnings to US steel spreads is extraordinary. Analysts estimate that every US$10 per tonne improvement in realised spreads adds approximately A$20m to EBIT. If current spot spreads persist, North Star alone could generate more than A$1bn in EBIT in the second half of FY27, equivalent to almost 7% of BlueScope’s entire current market capitalisation — in just six months.
This is a remarkable illustration of North Star’s underlying earning power, although we would not assume today’s exceptionally favourable steel margins will persist indefinitely. Higher steel prices encourage additional supply, and US protectionist measures do not eliminate competition between domestic steelmakers. Nevertheless, the scale of the improvement demonstrates the earnings potential of an exceptionally efficient industrial asset.
Australia is also improving
The Australian operations are performing better than expected, with management anticipating earnings approaching double those achieved in the second half of FY26. Stronger domestic despatch volumes and improved realised margins have more than offset slightly weaker benchmark steel spreads.
This is particularly encouraging given the weakness evident elsewhere in the Australian consumer economy. As recent commentary in the Australian Financial Review highlighted, a dramatic deterioration in enquiries at major residential developers raises questions about the future construction pipeline. However, an important distinction exists between declining prices for established houses and the prospects for new housing construction.
Government policies that encourage investment in newly constructed rental properties, rather than simply transferring ownership of existing dwellings, could provide valuable support for building activity. Australia desperately needs additional housing, and maintaining construction activity through a weaker property cycle is essential.
Cash returns provide further support
There is an additional benefit for existing shareholders. With major expansion projects largely complete, BlueScope is shifting from substantial capital expenditure to stronger free cash flow and shareholder distributions. The company plans to return about A$1.3bn to shareholders in calendar 2027, and the recent earnings upgrade could create scope for additional distributions.
This means BlueScope is increasingly realising the value of its strategic assets through earnings and cash returns rather than leaving it merely theoretical.
Stokes and the Americans (and us?) could see
The improvement in BlueScope’s earnings provides an interesting perspective on the takeover approach earlier this year from Kerry Stokes’ SGH and Steel Dynamics. We were pleased to support the proposed acquisition, believing both parties were particularly well placed to improve the businesses they intended to acquire.
In retrospect, the consortium’s timing was remarkably astute; we were confident in the medium-term value but less interested in the short-term spike. US steel conditions were beginning to improve, North Star was approaching a period of substantially stronger earnings, and BlueScope was nearing the end of a significant capital investment program.
The Australian equity market was not adequately recognising the underlying value of these assets. We shared that assessment, although we were happy to realise profits on part of our holding when the takeover proposal lifted the share price.
For SDI (Steel Dynamics), acquiring North Star would have meant securing an established, highly productive American steel business at precisely the point when its earning power was improving. The subsequent upgrade suggests that the acquisition could have been extremely profitable.
We also continue to believe that SGH’s management team could bring considerable value to the Australian operations. Its record of improving industrial businesses through operational discipline, capital allocation and management execution was central to our support for the original proposal.
The two bidders’ incentives may now be changing.
SDI could justify paying more for North Star, given improved US steel spreads and the strategic benefits of integrating the business into its existing operations. We are less convinced SGH would be willing to increase its contribution materially, particularly if doing so reduced the potential returns from improving the Australian assets.
The improving results also make the takeover question more interesting. BlueScope’s share price is now above the dividend-adjusted offer, and any renewed proposal would need to recognise the stronger earnings outlook and the shareholder returns now anticipated.
We cannot know whether the consortium will return. However, the latest result reinforces our view that BlueScope owns exceptional strategic assets that were undervalued when the proposal was first made.
The bidders recognised that opportunity, as did we. The improving operating performance is now providing the evidence.
Whether BlueScope’s decision to reject the proposal ultimately proves wise will depend on management’s ability to sustain this improvement and translate its strategic asset value into shareholder returns.
Aurelia Metals: A thriving business welcomes its new CEO
Regular readers of Investment Matters will be familiar with Aurelia Metals, a long-held portfolio investment operating polymetallic mines in the Cobar region of NSW, producing gold, copper, zinc and lead.
On Wednesday, we met with Aurelia’s new CEO, Steve Badenhorst, and were pleased with his early thinking on several important strategic decisions facing the company, particularly its future growth and capital allocation priorities.
The September quarterly result demonstrated that Steve inherited a thriving business. Production met or exceeded expectations, with gold, copper, and zinc output all increasing during the quarter.
Cobar operating cash flow reached an impressive $65.3m, its highest quarterly level since 2018.
Despite working capital drag and ongoing spending on the Peak processing plant expansion and Great Cobar development, Aurelia increased its cash reserves to $160.7m, with total available liquidity exceeding $200m.
For perspective, Aurelia’s market capitalisation is approximately $700m following the quarterly result. Its cash reserves therefore represent almost a quarter of its market value, providing considerable financial flexibility as the company progresses its development opportunities.
This is an excellent position for a new CEO to start from. Operations are performing strongly, the balance sheet continues to improve, and the company has attractive opportunities to expand production and extend mine life.
After selling off in recent weeks, Aurelia shares jumped more than 10% following the result.
We were pleased to see the market recognise the business’s strength and the considerable progress made in recent years.
Woolworths: Ooshies-enhanced sales, but what about margins?
Woolworths delivered an impressive first-quarter FY27 sales result, with Australian Food sales increasing 6.9% and comparable sales growing 6.1%. Stronger customer transactions and volumes provided welcome evidence that management’s efforts to restore the company’s competitiveness are working.
The return of the hugely popular Disney Ooshies collectables promotion contributed to the sales momentum, demonstrating the considerable power of Woolworths’ customer reach and promotional capabilities.
However, the result benefited from particularly weak comparable sales in the corresponding quarter last year. Australian Food comparable sales had increased only 1.6% in 1Q26, making the latest result easier to achieve. These comparisons become considerably more demanding over the remainder of FY27.
Christmas will be especially important.
We expect difficult economic conditions, increasingly price-conscious consumers, and elevated market expectations to force Woolworths to invest heavily in promotions, discounts, and other shopper incentives.
Ooshies’ success illustrates both the opportunity and the challenge. Promotions can increase customer traffic, transaction volumes and market share, but they are not necessarily inexpensive. Strong sales growth does not automatically translate into equally strong profit growth.
We suspect the promotional intensity required to sustain Woolworths’ recovery will pressure gross margins over the coming quarters.
We retain considerable respect for Woolworths’ competitive position, its scale and the enduring value of its supermarket network. However, we still view its share price as relatively expensive, especially given the more demanding sales comparisons ahead.
We have therefore been recently trimming our longstanding Woolworths position.
The issue is not whether Woolworths is recovering. It is how much of that recovery is already reflected in its share price — and what the company will need to spend to sustain it.
.