Copyright 2026 First Samuel Limited
This week we update Investment Matters Readers with three additional company results in detail. It would be a stretch to connect the three. Following meetings with the management teams of Inghams and Paragon Care, we have added detail on recent reporting-season updates.
The third piece for the week reviews the recently added position in Amcor, the global packaging business. An interesting business, it is also a strong example of how Australian share portfolios can provide exposure to much more than the domestic Australian economy.
At a time when International Equity exposure held by large industry funds and everyday investors is increasingly concentrated in 10 large US companies and the US market in general, we are continually reminded of the underlying point of true portfolio diversification. Diversification is meant to provide access to uncorrelated risk; replacing concentration in the Australian market (4 banks and 2 miners) with concentration in US tech companies is, at best, a partial solution.
Instead, we are reminded of the diversification we can achieve without concentration by accessing broad exposure to global trends in technology and products, while also gaining exposure to a range of economic outcomes in various countries.
Our international portfolios have higher-than-benchmark weights to the UK, Japan, Europe and Emerging Markets. But Australian stocks themselves, if invested with this in mind, provide significant international exposure
Our domestic Australian equity portfolio owns copper companies for global exposure to electrification demand; it owns Macquarie Group for its global investment focus alongside an emerging Australian banking franchise. Nanosonics sales are >80% overseas, Life360 has >90% of its customers in international markets, and Reliance Worldwide is a predominantly US and European operation. Part of the attraction of gold miners is the global price of the yellow metal. The list goes on….
Amcor, as a global business and top 10 packing firm by revenue, provides a diversified exposure to many countries’ economies, a wide range of industries as clients, and a range of technological and operating challenges.
Read the previous Investment Matters here
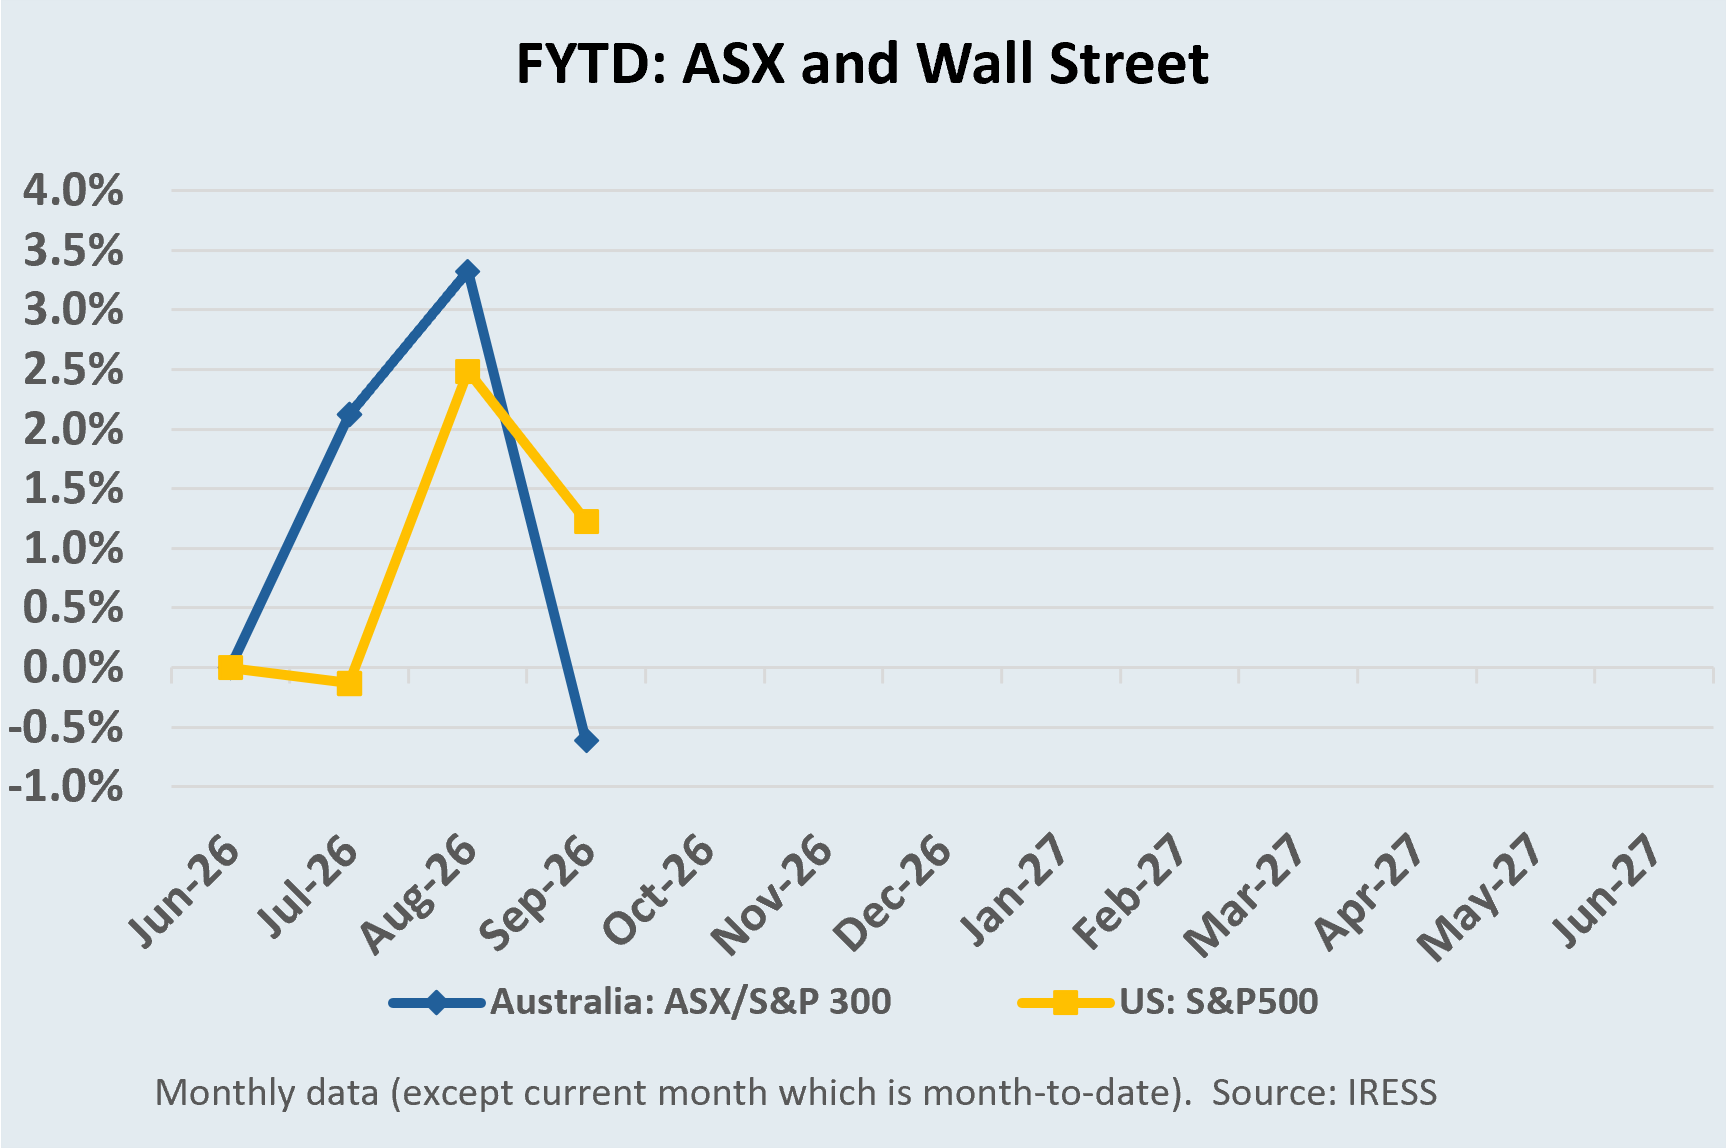
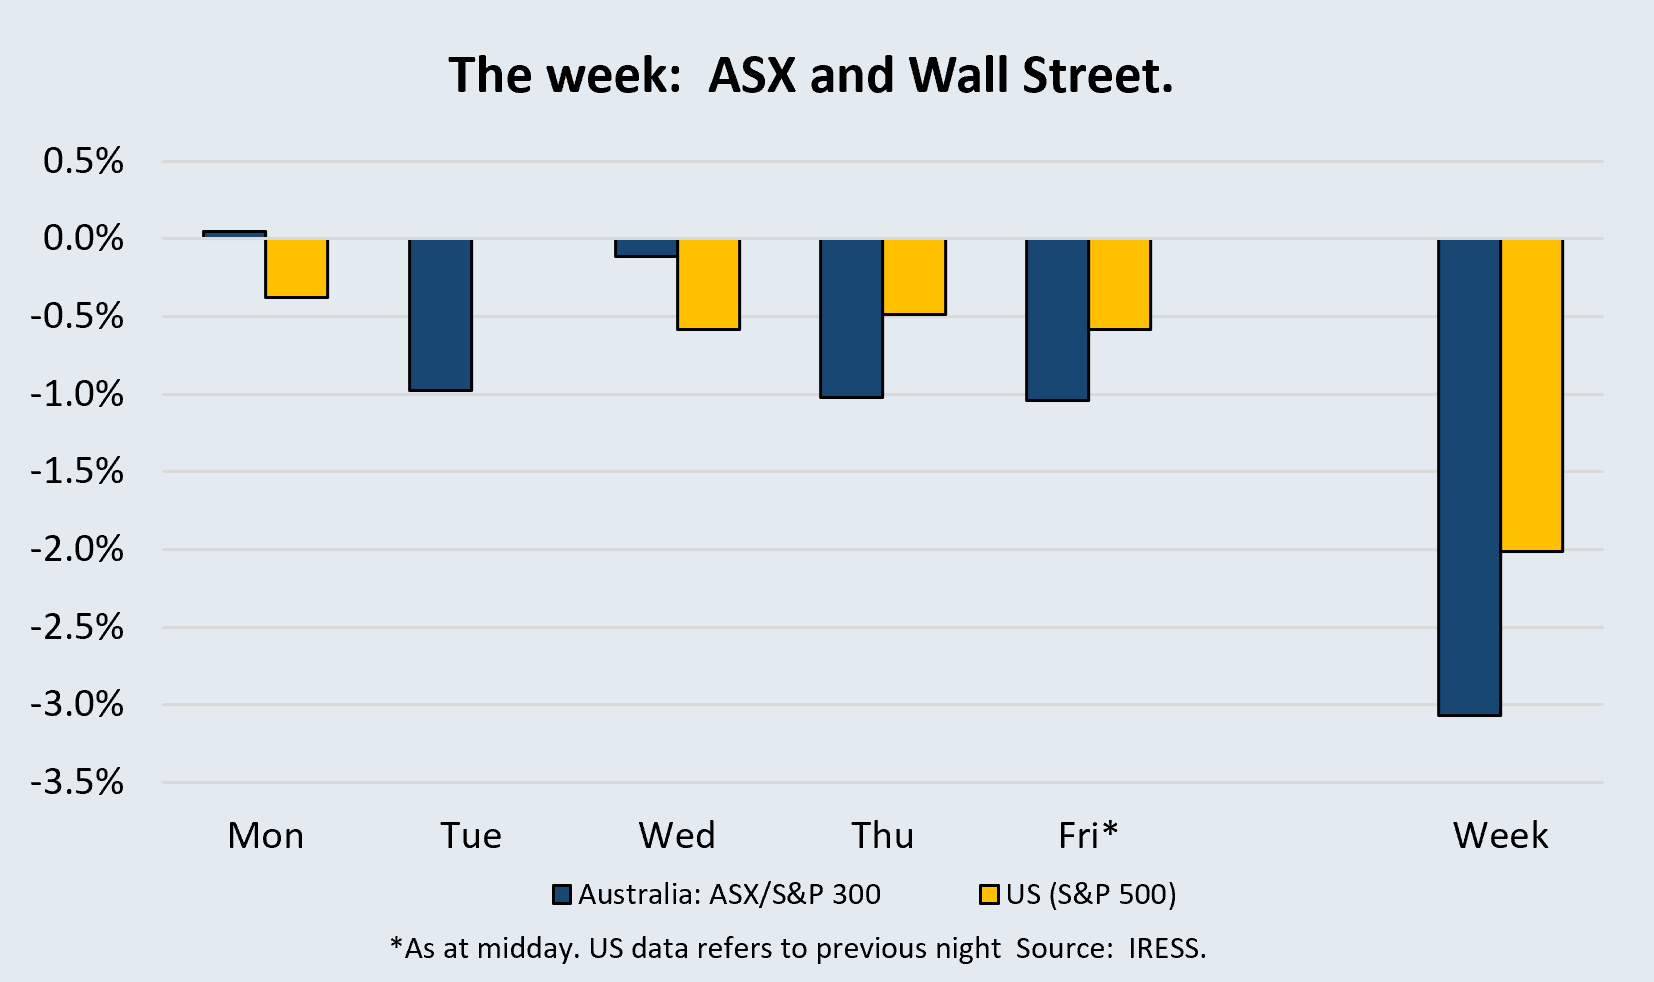
The market
Paragon Care (PGC) – Better Business, Less Market Confidence

Paragon Care is a long-held portfolio position and one that has travelled a considerable distance over the past two years.
The transformational merger with Clifford Hallam Healthcare — CH2 — was announced in March 2024, creating a healthcare distribution and medical technology group with more than $3bn of annual revenue. The market initially embraced the combination, and Paragon traded well above 40 cents for an extended period. Clients successfully reduced the position by more than 40% at those higher prices. The position has been highly profitable since the announcement, despite the share price decline.
Since then, much of that confidence has disappeared.
We met this week with CEO Carmen Riley and CFO Brendon Pentland to review the business in detail. Our conclusion was somewhat counterintuitive: despite the much lower share price, Paragon is a better business today in several important respects than it was when the market valued it above 40 cents.
The loss of confidence is understandable. Management has changed, although CH2’s founders remain closely involved. More importantly, Paragon Care scored a significant own goal through the losses associated with Infinity Pharmacy Group. At the same time, investors have become less willing to pay a premium for founder-led, acquisitive businesses with meaningful leverage.
The rotation of several major wholesale contracts also unsettled the market. These contracts can involve enormous headline revenue but relatively modest underlying profitability. The Ramsay Healthcare contract, for example, represented approximately $230m of FY25 revenue but less than 2% of group gross margin. Losing that revenue therefore sounds considerably worse than the associated earnings impact.
That distinction between revenue and gross profit is critical to understanding Paragon. The market still views the business’s ability to generate cash and support high levels of working capital-related debt as a concern, but less so from our perspective.
Former CH2 — the core wholesaling business
Over recent months, we have spent considerable time looking more deeply into CH2 and the economics of community pharmacy.
The sector is unusual. Individual pharmacies are generally small businesses, yet they operate within a highly structured healthcare system supported by government policy, regulation and recurring pharmaceutical demand. Pharmacy location rules constrain new competition, while Commonwealth arrangements support the reliable distribution of PBS medicines across Australia.
Our work on the economics and motivations of community pharmacies left us more comfortable with the quality of CH2’s underlying customer base. These are often modest-sized businesses, but they participate in an industry with strong structural support and relatively predictable demand.
That does not eliminate credit risk, Infinity demonstrated that very clearly — but it gives us greater confidence in the broader foundations of the wholesaling business. The FY26 result provided useful evidence of those underlying conditions. The table below outlines key aspects.
Australia and New Zealand wholesale revenue declined 5.2% to $2.83bn, largely reflecting the Infinity and Ramsay exits. Normalising for those lost businesses, revenue increased around 1.5%. More importantly, wholesale gross margin improved from 6.0% to 6.3%. A 5% revenue fall reduced margins by only 1.3%. For a business operating at enormous revenue and relatively thin margins, small gross margin improvements can meaningfully affect earnings.
Figure #1: Paragon Care – A & NZ revenue and gross margin by channel
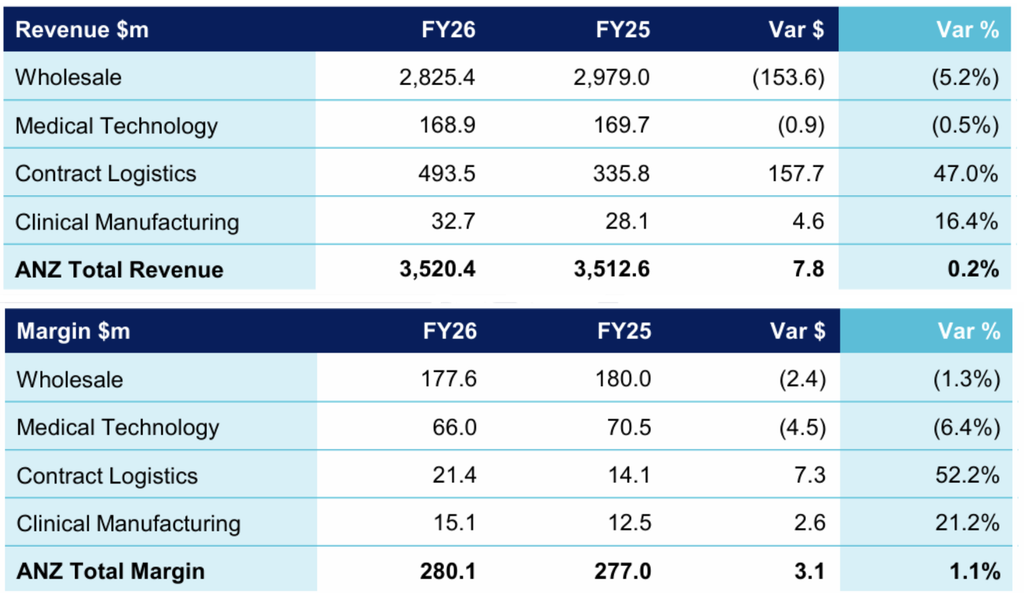
Source: PGC FY26 Results Presentation
The former Paragon businesses are improving
The other side of the group is also becoming more interesting.
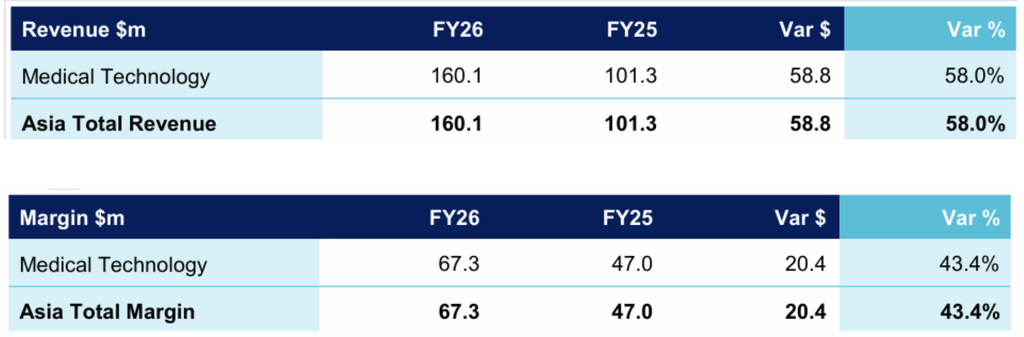
The former Quantum Healthcare business forms the foundation of Paragon’s Medical Technology operations in Asia. FY26 was particularly encouraging. On the theme of the week, Paragon is a small company with 20 per cent of gross margins drawn from Asia, its fastest-growing segment.
Figure #2: Paragon Care – Asia revenue and gross margin
Source: PGC FY26 Results Presentation
Asia revenue increased 58% to $160m, driven by both acquisitions and the existing business. Organic growth was around 13%, while gross margin dollars increased 43% to approximately $67m. The business has expanded across Asia through acquisitions including Somnotec, Haju Medical and Pacific Medical. Management has moved quickly to integrate these businesses and broaden the products sold across the enlarged distribution network.
This contrasts with some of the Paragon acquisitions made seven to ten years ago, where promised benefits proved elusive. There is considerably more evidence of successful execution today.
Several acquisition earn-outs depend on the acquired businesses achieving growth targets set when they were purchased. Based on our discussions with management, a number appear likely to be paid during the next 12 months. In these circumstances, paying the earn-outs would be a positive outcome: it would indicate that the acquired businesses had delivered the earnings growth expected when they were bought.
Infinity — a costly own goal
The largest setback was Infinity. Paragon Care recorded a substantial bad-debt provision against its exposure to Infinity Pharmacy Group, materially reducing FY26 reported earnings. It was an expensive failure of credit control and a reminder that a low-margin wholesaling business cannot afford large customer losses.
We therefore look through the statutory result to assess the business’s underlying earnings power, while making an additional adjustment for rental and lease costs.
On that basis, the underlying EBITDA result was pleasing for three reasons.
- First, earnings are growing.
- Second, the earnings base is sufficient to support the current debt load.
- Third, it provides a foundation for further organic growth and disciplined acquisitions.
FY26 underlying EBITDA was approximately $97m, while net debt finished the year at around $284m, equivalent to roughly 2.5 times pro forma underlying EBITDA.
Leverage remains an issue, and we understand why the market focuses on it. But growing earnings, improving margins and stronger cash generation make that leverage considerably more manageable than it would be in a deteriorating business.
Our Take
The market has substantially reduced the value it is prepared to place on Paragon Care. Some of that is justified. Infinity was a serious mistake, leverage remains meaningful, and the company’s acquisition history means management still has work to do rebuilding credibility.
But the present valuation also appears to give little credit for the improvements that have occurred. The share price tells us confidence has been lost.
Our meeting with Carmen Riley and Brendon Pentland reinforced our view that the underlying business has nevertheless improved.
The next step is straightforward: management now needs to convert that improvement into sustained earnings, cash flow and lower leverage. If it does, the gap between the quality of the business and the market’s current assessment should eventually narrow.
Inghams Group: the discount doesn’t fit the improving underlying picture
FY26 was never going to be pretty, and it wasn’t. Underlying EBITDA pre-AASB16 of $186.4m fell 21% in FY25 and landed at the low end of guidance. Middle East-driven fuel and packaging costs, feed inflation and the operational reset around the Ingleburn transition all weighed on earnings.
Beneath the headline. Progress.
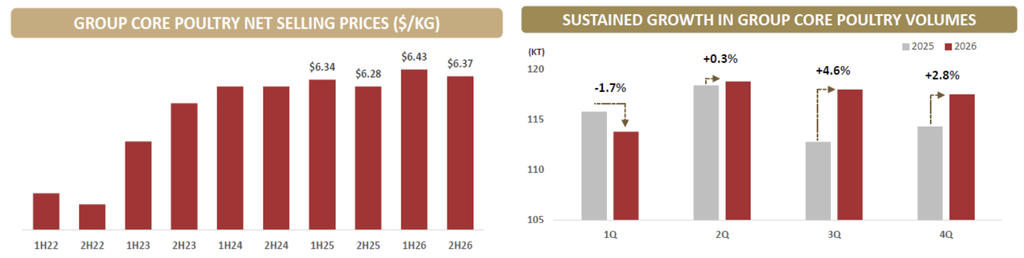
Yet the second half looked materially better than the first. Group revenue increased 4.9% in 2H26, Australian revenue rose 9%, core poultry volumes returned to growth and price per kilogram increased around 4%. At the same time, cost of goods sold per kilogram fell 2.5%. EBITDA improved from $80.6m in 1H26 to $105.8m in 2H26 as inventories normalised, production stabilised, and processing yields improved. Cost-out delivery of $82.3m exceeded the top end of management’s target.
Figure #3: Inghams – Poultry Volumes and Pricing
Source: Inghams FY26 Results Presentation
The lost Woolworths volume has now been more than replaced through Coles, ALDI, Metcash and a new Nando’s supply agreement. Operating cash flow also held up better than earnings, with cash realisation of 105.5% and both inventories and receivables falling.
We met the management team during the past week and were impressed by the focus on execution. Inghams has a very large cost base and therefore several levers available to offset external pressures. Small changes in retail and wholesale pricing, procurement, feed conversion, production yields, and inventory can quickly translate into meaningful EBITDA.
Craig Woolford at MST makes the same point from another angle: the second-half combination of higher pricing and lower COGS per kilogram provides a much better starting point for FY27 than the headline FY26 decline suggests.
Guidance spooked the market
FY27 guidance of $190–220m of pre-AASB16 EBITDA disappointed the market and us. It incorporates around $30m of additional Middle East-related transport and packaging costs and a further $40–50m headwind from higher feed costs.
Those numbers are substantial, but they are gross headwinds rather than necessarily permanent earnings losses. Feed, freight and packaging inflation are industry-wide, giving Inghams scope to recover a meaningful proportion through pricing. Woolford estimates that each 1% movement in wholesale pricing changes EBITDA by around $7m, illustrating both the risk and the leverage available to management.
His $218m FY27 EBITDA estimate sits near the top of guidance, based on improving volume trends, better pricing and a cleaner inventory position. We are less interested in whether FY27 lands at $205m or $218m than whether the second-half operational improvement continues.
Predator circling?
That distinction becomes more important while takeover speculation persists. Press reports in August linked Canadian pension investor PSP Investments with potential interest in Inghams1. No formal proposal has been received, but this is the second period of corporate speculation this year. The AFR reports PSP is trying to fit Inghams into “its $20 billion natural resources arm, which invests in timber, agriculture and related opportunities. The unit is one of Australia’s biggest agricultural investors, owning stakes in Ellerslie Free Range Farms (owner of the popular Sunny Queen egg brand), beef producer Hewitt, milk producer Aurora Dairies and walnut giant Stahmann Webster. It owns vast tracts of pastoral and farming land, as well as water entitlements.”
As Reliance Worldwide and Cleanaway have both attracted bids, the pattern is becoming uncomfortable. Public equity markets are focusing heavily on near-term earnings uncertainty at businesses with difficult-to-replicate assets, while long-duration private capital is prepared to look through it.
The risk is that another substantial Australian business disappears from the ASX at a price that reflects temporary earnings pressure rather than long-term strategic value.
Not riskless, but the share price knows
There are genuine risks. Net debt to EBITDA of 2.2x remains above management’s 1–2x target range, while wholesale pricing can move quickly and higher feed, oil and packaging costs need to be recovered.
We are less inclined to view avian flu as simply another earnings risk. An outbreak directly affecting Inghams’ own production would clearly cause disruption. However, experience overseas suggests the impact on broiler production has been considerably smaller than on egg producers, while reduced industry supply can ultimately support poultry pricing and improve the economics of producers able to maintain production. Inghams’ scale, integrated operations and geographic diversity should leave it better placed than most competitors to manage such an environment.
The market is still largely focused on the next cost print. We are more interested in the earnings power of a scarce, integrated poultry platform once operations normalise.
With takeover speculation continuing, that distinction matters more. The danger is not simply that near-term earnings disappoint. It is that public markets remain so preoccupied with those risks that they allow a strategically valuable business to be acquired too cheaply.
Amcor (AMC): Synergy Delivery with Volume Optionality
Overview — a global business hiding behind an ASX ticker
Amcor is a recent addition to client portfolios in 2026. We are attracted to high-quality, stable businesses that are not yet attracting a market price premium, particularly where there are identifiable opportunities to grow earnings without relying on a strong economic cycle.
This note covers the FY26 results from August 13th along with a revisit of the investment thesis.
Amcor fits this description well. It trades on the ASX as AMC, but this is emphatically not an Australian packaging business. Amcor is also listed in the United States and, following the acquisition of Berry Global, generates approximately US$23bn of annual sales from operations across more than 40 countries. A note in the introduction: similar to many companies in our portfolios, its Amcor’s ASX listing provides access to a genuinely global earnings stream.
It also begins from an attractive valuation. Amcor trades on a relatively low earnings multiple while providing a dividend yield comfortably above 5%. We therefore do not need aggressive assumptions about economic growth or packaging demand to see value.
The FY26 result strengthened this case. Adjusted EPS increased 13% for the year and 23% in Q4, Berry synergies were delivered ahead of schedule, margins improved, and group volumes finally returned to modest growth after almost two years of decline.
We are encouraged by that volume result. We would not, however, build the investment case around a sustained recovery in packaging demand. Instead, we see the return to positive volumes as early evidence of the optionality embedded in the investment. Amcor has considerable opportunities to improve earnings through integration benefits, procurement, productivity, margin improvement and portfolio rationalisation even if packaging demand remains subdued. If volumes continue to improve, that provides another leg of earnings growth on top of those self-help measures.
What does Amcor actually make?
Packaging sounds simple, but Amcor’s portfolio spans products with quite different economics. Talking with industry experts, we were amazed by the mix of high-tech solutions and basic products, the mix of margins, and the vast range of balancing market power, especially between customers and companies such as Amcor. Some products are customer-dominated, while others leave companies with significant power and economic profit.
The company now divides its operations principally between Global Flexible Packaging Solutions and Global Rigid Packaging Solutions.
Flexible packaging includes films, wrappers, pouches, sachets and specialised packaging used across food, beverages, healthcare, pharmaceuticals, personal care and household products.
These can range from enormous-volume everyday food packaging through to technically demanding healthcare products where sterility, shelf life, product protection and regulatory requirements are critical. Packaging is typically a very small proportion of the customer’s final product cost, but failure can be extraordinarily expensive. That creates attractive economics in the more specialised parts of the portfolio.
Rigid packaging includes bottles, jars, containers, closures and dispensing systems, particularly PET packaging used for beverages, food, household products and personal care.
These tend to be more volume- and manufacturing-utilisation intensive. A beverage bottle can be produced in enormous numbers but earn a relatively small margin per unit. Scale, procurement, manufacturing efficiency and plant utilisation therefore matter enormously.
This distinction helps explain why Flexibles currently earns higher margins, while Rigids presents the larger margin-improvement opportunity.
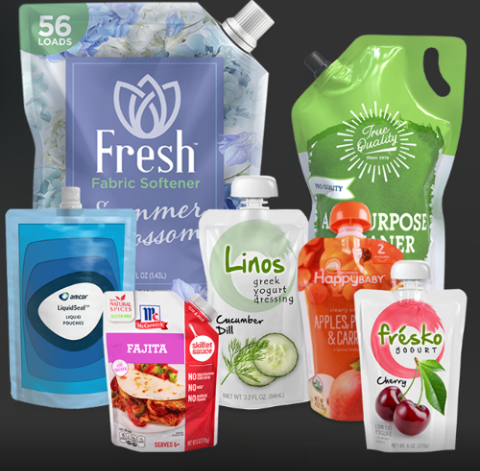
Amcor flexible packaging formats — stand-up/spouted pouches across home care, condiments, dressings and nutrition.*
Global Flexible Packaging Solutions — the higher-margin engine
Flexibles is the larger and more mature business, combining legacy Amcor Flexibles with Berry’s flexible and engineered-products operations.
Reported Q4 net sales increased 18% and adjusted EBIT increased 23%. Around half of the revenue growth was acquisition-related, and a further component reflected the pass-through of higher raw-material costs, so the comparable numbers are more useful in assessing the underlying business.
On a like-for-like basis, sales increased around 8%, volumes increased approximately 1%, and adjusted EBIT increased around 18%. Of that EBIT growth, synergies contributed approximately 12 percentage points, with organic volume and productivity contributing the balance.
Margins also improved. Q4 adjusted EBIT margin increased to 15.1% from 14.5%, while the full-year margin held at 13.9% despite incorporating lower-margin Berry businesses still being integrated.
That is an important outcome. Flexibles protected and improved profitability despite weak demand conditions and adding businesses that initially dilute the segment margin.
The return to approximately 1% volume growth in Q4 is also noteworthy. Full-year comparable volumes were still negative, so we would not describe this as evidence of a sustained recovery yet. But after almost two years of falling volumes, the fact that they have stopped declining and moved modestly positive provides evidence of the upside optionality in our investment case.
If volumes remain flat, synergies and productivity can continue to grow earnings. If they begin to rise, the incremental benefit should increasingly fall through an already improving cost base.
Growth synergies also extend beyond the cost program. Combining Amcor’s and Berry’s product ranges allows the company to cross-sell a broader suite of packaging into existing customers. Management has already generated around US$140m of annualised revenue from these initiatives, roughly halfway towards its three-year revenue target.
Price and mix remain a modest drag in parts of the business, particularly where management is prioritising volume recovery and customer retention over price. That is worth watching, but we regard it as less important than the combination of stable margins, early volume improvement and synergy capture.
Global Rigid Packaging Solutions — where the margin opportunity sits
The Berry acquisition has transformed Rigids. FY26 net sales more than doubled versus FY25 and, unlike Flexibles, the important story here is the substantial gap between where margins are today and where they could eventually get to.
Adjusted EBIT margin improved from 8.8% to 11.0% for FY26, and from 10.5% to 12.3% in Q4. On a comparable basis, Q4 adjusted EBIT increased around 24% on approximately 7% higher sales and only around 0.5% higher volumes. Management attributes roughly 19 percentage points of that EBIT growth to synergies alone.
The reported growth numbers are flattered by the Berry acquisition and raw-material pass-through, but the underlying margin improvement is real. Rigids does not require strong volume growth to create value. Better procurement, integration, manufacturing efficiency, portfolio mix and removal of underperforming assets can substantially improve returns from the existing revenue base.
At the same time, the modest positive volume outcome provides the same optionality evident in Flexibles. A business already generating substantial EBIT growth on almost flat volumes would have considerably more earnings torque if volumes eventually improved more meaningfully.
Rigids remains the lowest-margin segment in the group, at 11.0% for FY26 compared with 13.9% for Flexibles, so it still has considerable distance to travel. That gap is the opportunity.
Non-core performance also improved during the year, reducing what had previously dragged on segment earnings. More importantly, Amcor has agreements to sell six non-core businesses with approximately US$500m of combined transaction value, five of which had already closed. Removing these businesses should mechanically improve the quality and margin profile of what remains.
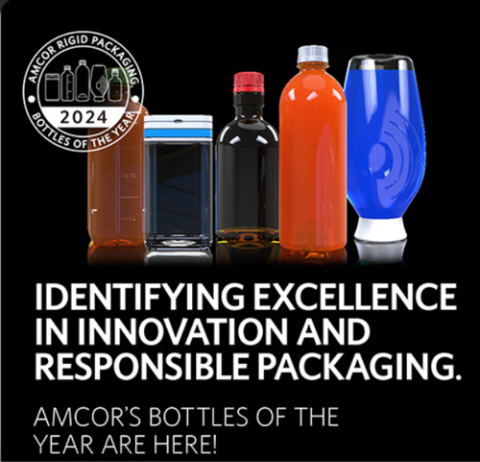
Amcor Rigid Packaging “Bottles of the Year” — PET formats across beverages, spirits and personal care.*
Berry synergies — the clearest FY26 success
The strongest element of the FY26 result was delivering merger synergies (Amcor merged with Berry, a $USD 8.4bn company, in November 2024).
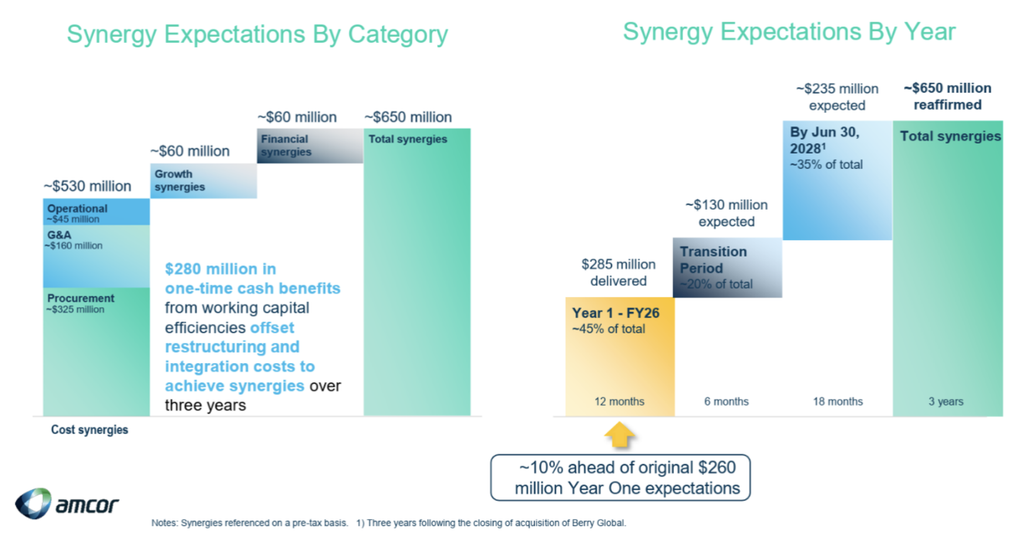
Amcor has targeted US$650m of benefits over three years. It delivered US$285m in FY26, approximately 10% ahead of its original US$260m first-year target. A further approximately US$130m is expected during the transition period, with the remaining roughly US$235m expected by June 2028.
Figure #4: Amcor – Ahead of schedule on Berry merger metrics
Source: Amcor 4QFY26 Results Presentation
Procurement is the largest single bucket in the cost program at approximately US$325m, followed by around US$160m in G&A savings and US$45m in operational synergies. Growth and financial synergies make up the balance.
These are relatively tangible opportunities: combining the purchasing power, manufacturing footprint and corporate infrastructure of two enormous packaging companies.
This is why the investment case does not depend upon forecasting stronger packaging markets.
Portfolio simplification, cash flow and the Iran drag
Amcor is also simplifying the acquired portfolio. It identifies approximately US$20bn of its revenue base as core, with around US$2.5bn of businesses being optimised or exited.
The core business already earns better margins than the group as a whole, so disposing of weaker assets should gradually improve the quality of the remaining earnings base.
Cash flow was the principal disappointment in FY26. Free cash flow of US$1.3bn was weaker than expected, with management citing higher working capital and integration costs. The Iran conflict contributed by forcing the company to carry additional inventories at a higher cost.
Management expects to recover more than US$500m of working capital over the next 12 months. With leverage ending FY26 at around 3.5 times net debt/EBITDA, delivering that cash is now an important test.
The renewed Iran conflict is therefore relevant again. Higher oil prices affect resin, energy, freight and inventory costs and can pressure Amcor’s customers as well.
Interestingly, Amcor’s daily share-price returns have had approximately a -0.31 correlation with daily oil-price movements over the past 12 months. It is not a perfect relationship, but it reinforces the observation that periods of sharply higher oil prices have generally been unhelpful for the shares.
Our Take
FY26 strengthened rather than changed our investment case.
Amcor offers a combination we find attractive: a globally diversified and relatively defensive business, a dividend yield above 5%, a low earnings multiple (11x), and substantial opportunities for management to improve earnings without relying on stronger economic conditions.
Berry has created significant self-help. Synergies are running ahead of plan. Flexibles remains a high-margin and resilient core business. Rigids has considerable scope to close its margin gap. Non-core assets are being removed, and cash released from working capital should allow leverage to fall.
Against that base case sits the optionality from volume growth.
For much of the past two years, packaging volumes have been declining. FY26 ended with the first modest positive movement in some time. We do not regard one quarter as proof of a sustained recovery, but we do regard it as evidence that the negative volume drag may be easing.
That matters because the earnings improvements described above have largely been achieved without much help from demand.
If volumes simply stabilise, synergies, procurement and margin improvement can continue to drive earnings. If volumes return to sustained growth, Amcor should have materially greater operating leverage through the enlarged Berry platform.
That is the attraction: We are not paying a high price for volume recovery, nor do we require one for the investment to work. But the FY26 result gives us the first evidence that this additional source of upside may be emerging.
The information in this article is of a general nature and does not take into consideration your personal objectives, financial situation or needs. Before acting on any of this information, you should consider whether it is appropriate for your personal circumstances and seek personal financial advice.