Company review · Metcash
Metcash: A Stock for the Times
Metcash is one of the more misunderstood companies on the ASX. It is often grouped with supermarkets, yet it works very differently, and its valuation looks unusually low on some measures for partly structural reasons. Understanding the business explains why we continue to like it, and why it suits the current environment of sticky inflation, higher interest rates and cautious consumers.
Copyright 2026 First Samuel Limited

The market
FYTD: ASX and Wall Street
Oct 2026 (MTD) · Australia -1.7113% · US +2.2193%
Source: IRESS. View original chart ↗
View chart data
| Period | Australia: ASX/S&P 300 | US: S&P 500 |
|---|---|---|
| Jun 2026 | 0.0000% | 0.0000% |
| Jul 2026 | +2.1200% | -0.1300% |
| Aug 2026 | +3.3250% | +2.4866% |
| Sep 2026 | +0.0496% | +2.0254% |
| Oct 2026 (MTD) | -1.7113% | +2.2193% |
The week: ASX and Wall Street
Week · Australia -0.4162% · US -0.9188%
Source: IRESS. View original chart ↗
View chart data
| Period | Australia: ASX/S&P 300 | US: S&P 500 |
|---|---|---|
| Mon | +0.1296% | -0.3757% |
| Tue | +0.3519% | +0.3519% |
| Wed | +0.9015% | +0.9015% |
| Thu | -1.9791% | -1.9791% |
| Fri* | +0.2038% | +0.2038% |
| Week | -0.4162% | -0.9188% |
How Metcash’s wholesale and retail model works
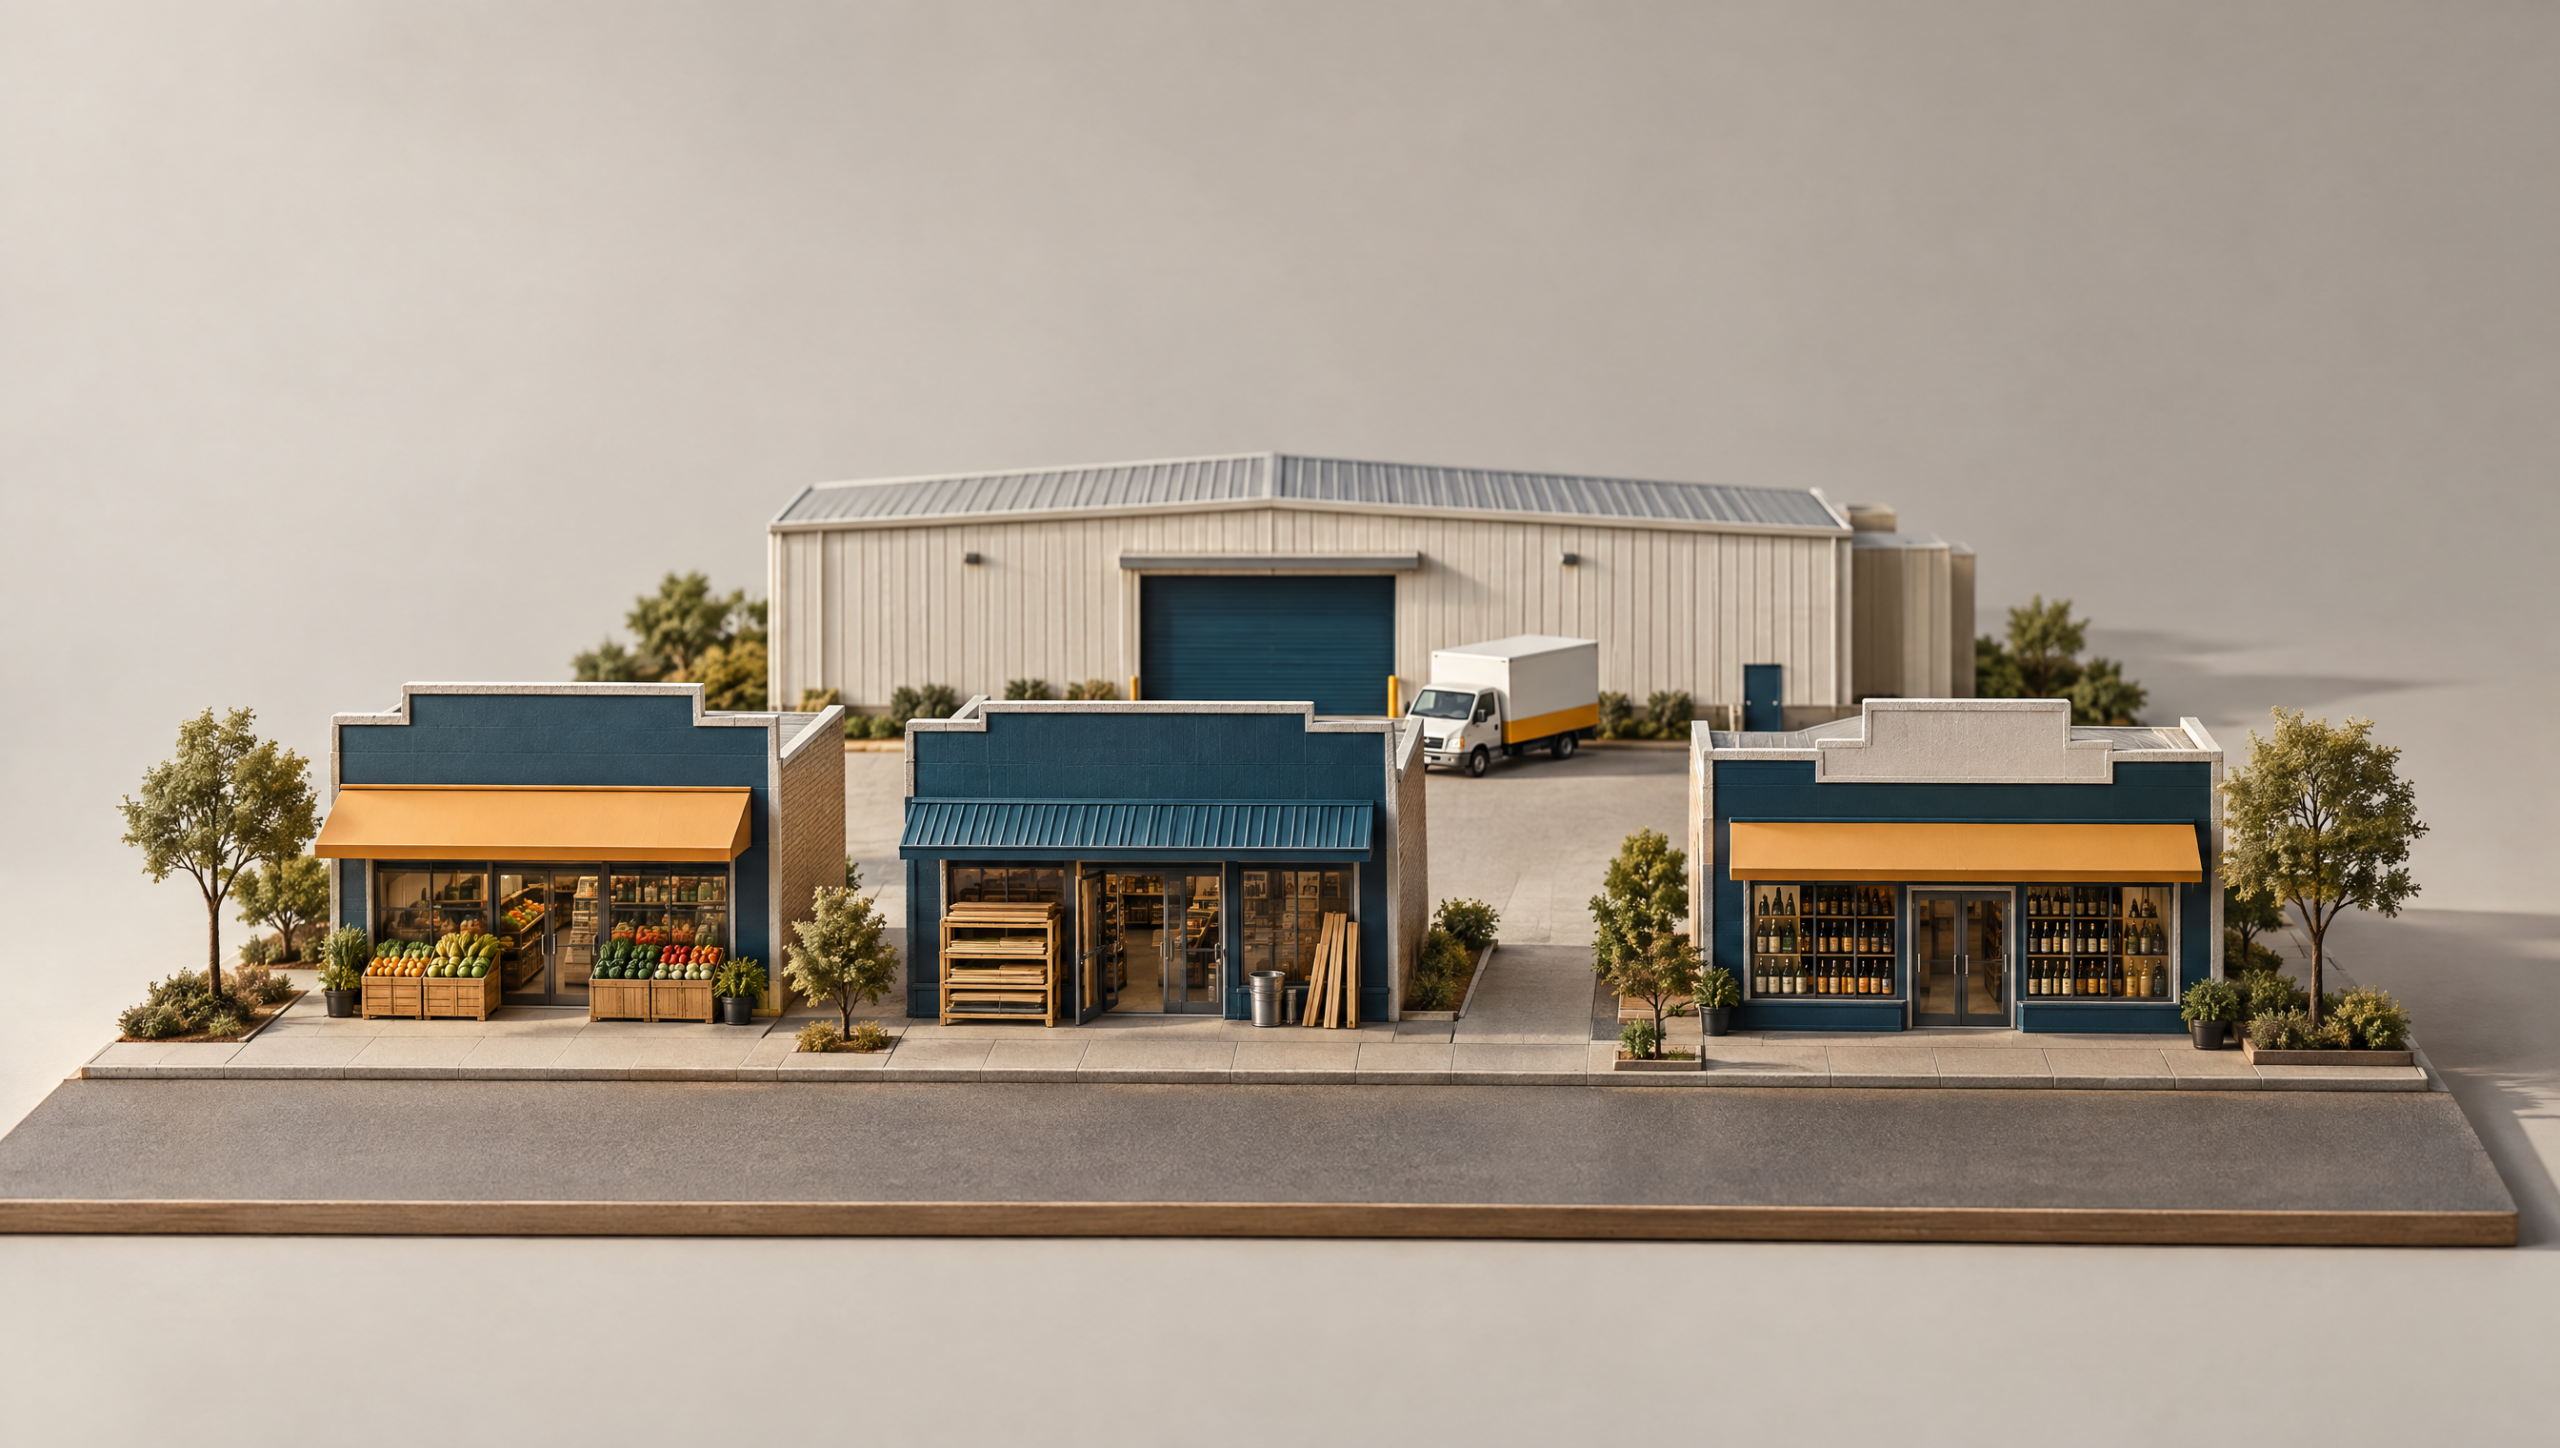
Metcash is not a supermarket chain like Coles or Woolworths. It is the wholesaler, supply chain and brand owner behind about 6,300 independently owned stores, including IGA, Foodland, Mitre 10, Total Tools, Cellarbrations and The Bottle-O. The local owner funds the store, lease, and staff.
Metcash supplies the product through 62 distribution centres and provides buying scale, the banner, marketing and data.
It is not purely a wholesaler, though. Metcash also makes retail sales directly through a growing group of hybrid and company-owned stores. It holds majority stakes (51–95%) in around 50 Total Tools stores run as joint ventures with their operators, with options to move to full ownership over time. It owns trade supply businesses such as Bianco, and it has recently started buying IGA supermarkets.
Retail now contributes about 12.5% of group earnings, up from under 8% in FY20.
Metcash
The brands behind the business
Select a logo to explore the business and its connection to Metcash.
Food
IGA
What it does
A supermarket brand used by a network of local, independently operated grocery stores.
How Metcash is involved
IGA is part of the supermarket network supported by Metcash’s Food business. Metcash provides wholesale supply and support to retailers; the IGA banner does not mean every store is owned by Metcash.
Food
Foodland
What it does
A supermarket brand associated with South Australia, with locally owned, independent stores.
How Metcash is involved
Metcash includes Foodland in the supermarket network supported by its Food business. It is a wholesale and retailer-support relationship, rather than a claim that Metcash owns every Foodland store.
Food & convenience
Campbells / C-Store
What it does
A wholesale convenience business serving customers such as convenience shops, service stations and food outlets.
How Metcash is involved
Metcash brought Campbells Cash & Carry and C-Store Distribution together within its Convenience business. This is a wholesale operation within Metcash, rather than simply a supermarket banner.
Liquor
Cellarbrations
What it does
A liquor retail brand used by independently owned and operated bottle shops.
How Metcash is involved
Cellarbrations belongs to Metcash’s Independent Brands Australia (IBA) network. Metcash supports these retailers with liquor supply, national buying power, marketing and promotional programmes.
Liquor
IGA Liquor
What it does
A network of independently owned liquor stores with ranges tailored to local customers.
How Metcash is involved
IGA Liquor is a brand in Metcash’s Independent Brands Australia (IBA) network. Metcash’s liquor business provides wholesale supply and retailer support, including buying power and marketing.
Liquor
The Bottle-O
What it does
A bottle-shop brand whose independently owned retailers serve their local communities.
How Metcash is involved
The Bottle-O forms part of Metcash’s Independent Brands Australia (IBA) network. Metcash supports the network through liquor supply, buying power, marketing and promotions; individual retailers operate their stores.
Hardware
Mitre 10
What it does
A hardware and home-improvement network serving trade customers and household projects.
How Metcash is involved
Mitre 10 is a brand within Metcash’s Total Tools and Hardware Group. Its wholesale and retail-support operations serve a network that includes independent hardware retailers.
Hardware
Home Hardware
What it does
A hardware-store brand supplying building materials, tools and home-improvement products to trade and DIY customers.
How Metcash is involved
Home Hardware sits alongside Mitre 10 in Metcash’s hardware business, within the Total Tools and Hardware Group. Metcash supports the brand’s network of independent retailers.
Professional tools
Total Tools
What it does
A specialist professional-tools retail network serving tradespeople.
How Metcash is involved
Metcash is the franchisor to Total Tools and includes it in its Total Tools and Hardware Group. The franchise relationship is distinct from the ownership of individual stores.
This is the “third level” of Australian retail: the local grocer, the local hardware store and the local bottle shop. The model needs far less capital than the chains, and it still reaches about 95% of Australians. It also gives investors three essential categories in one company. When one pillar is soft, the others tend to carry the group.
FY26 operating earnings (EBIT) by pillar
FY26 operating earnings · select a pillar above
View supplied chart values
| Pillar | FY26 EBIT (A$ million) |
|---|---|
| Food | 210 |
| Hardware & Tools | 177 |
| Liquor | 100 |
| Food Service | 52 |
Mitre 10 and Bunnings: similar shelves, different models
Mitre 10 is inevitably compared with Bunnings. Customers see paint, timber, power tools and garden products in both stores. Underneath, however, the businesses are quite different.
Bunnings owns its big-box warehouses and earns a retail margin of about 12%. Mitre 10 and Home Hardware are networks of local owners, many of whom are heavily exposed to tradespeople, builders, and building materials. Metcash’s hardware operations earn closer to wholesale-style margins of around 5%.
The stores also serve different markets. Bunnings has progressively moved towards a mass-affluence home-improvement model: large-format destination stores selling everything from timber and plumbing supplies to barbecues, outdoor furniture, plants and homewares.
Mitre 10 and Home Hardware retain much greater exposure to repair and renovation (R&R) and trade. Metcash describes Trade as remaining at the core of Mitre 10, while Home Hardware ranges from the serious renovator through to the handyman. The stores tend to be smaller, more local and often more deeply connected to builders and trades in their immediate area.
That makes them less dependent on convincing households to spend Saturday afternoon wandering through a warehouse, but more exposed to actual building, maintenance and renovation activity.
That distinction matters today because Australian residential construction remains subdued. Metcash’s corporate hardware stores have consequently been operating well below their potential. Craig Woolford of MST Marquee estimates operating margins have almost halved, from about 7% in FY23 to under 4% in FY26, as trade volumes fell against a largely fixed cost base.
This is a short-term problem but could also be a source of operating leverage. Hardware sales rose 6% in the first 18 weeks of FY27, with Total Tools up almost 10%, even before a meaningful recovery in housing construction. On Woolford’s estimates, a 10–15% lift in corporate store sales would add 4–9% to group earnings per share.
Australia still needs houses, repairs, and renovations. High interest rates, construction costs and builder failures have constrained activity rather than permanently eliminated it. A normalisation of housing construction and R&R activity would therefore improve volumes through Mitre 10 and Home Hardware while spreading the relatively fixed costs of Metcash’s owned stores across a larger revenue base.
Hardware is consequently both one of Metcash’s clearest near-term cyclical problems and one of its more interesting medium-term recovery opportunities.
How Superior Foods fits
The 2024 purchase of Superior Foods took Metcash into foodservice: cafés, quick-service restaurants and institutions. Combined with Campbells, which has been part of the group since 1999 and serves convenience stores and fuel retailers, it forms a Foodservice and Convenience business whose sales have grown 38% a year since FY23. Superior’s cost savings beat the $14 million target, and recent supply contracts with BP and Ampol show the platform can win large customers.
We love the food-service business in general; it supports businesses that increasingly rely on wholesalers such as Superior Foods at the core of their business models. When was the last time you went to a café and ate only goods made on premises? Woolworths owns a similar $3.7bn revenue business in PFD Foods, and although Metcash generates sales of more than $2.4bn, it remains a lower-margin business than Woolworths and could drive higher margins in the future.
More broadly, foodservice fits surprisingly neatly with what Metcash has always done. Thousands of cafés, restaurants, pubs and institutions create fragmented demand. Metcash aggregates that demand, buys at scale and provides the logistics. In that sense Superior is less a diversification away from Metcash’s historic capability than an application of the same capability to a new customer base.
Why Metcash is buying IGA stores
Metcash has also started buying selected IGA stores. It plans to spend $40–60 million a year, with a long-term aim of owning stores that make up 25–30% of IGA network revenue. The logic is to strengthen the network, speed up initiatives such as loyalty and retail media, and capture retail margin that currently sits outside the group. Metcash has owned stakes in its largest networks, such as Drakes and Ritchies, for more than a decade, but the acquisition schedule has recently broadened.
The stores are also relatively cheap to buy. MST Marquee estimates the plan implies a price of about 4 times operating profit, well below what Metcash itself trades on. An obvious candidate is Champions IGA, a 14-store Victorian group in which Metcash already owns 49%.
Tobacco: from headwind to tailwind
Tobacco has been the biggest drag on Metcash’s reported sales in recent years. Its tobacco sales more than halved, from an estimated $2.8 billion in FY22 to $1.3 billion in FY26, as illicit tobacco took over the market. It is estimated that more than 70% of nicotine consumed in Australia now comes from illicit tobacco and vapes.
The key point for investors is how little profit was lost. Metcash says tobacco’s decline has cost it about $25 million of operating profit since FY21, on a sales fall of about $1.1 billion. That is a margin of roughly 1.5 cents in the dollar. So the collapse hurt the sales line far more than earnings. The trend has now turned. Stronger enforcement is closing illicit outlets, and new contracts with BP and Ampol have added volume. Tobacco sales rose almost 12% in the first 18 weeks of FY27. Tobacco is still low-margin, but it no longer drags on the headline numbers.
Liquor and the long-term GLP-1 question
Liquor has been one of Metcash’s quiet successes. Its Independent Brands Australia network includes Cellarbrations, The Bottle-O, IGA Liquor and Porters, while Australian Liquor Marketers supplies more than 12,000 customers including pubs, bars, restaurants and hotels. Metcash’s packaged-liquor market share increased 2.7 percentage points between FY22 and FY25 to 31.1%, helped by the convenience of smaller local stores and locally tailored ranges.
However, the industry faces a new long-term question: GLP-1 drugs.
Drugs such as Ozempic and Wegovy were developed for diabetes and obesity, but there is growing evidence that their effect on appetite and reward extends to alcohol. A 2025 randomised clinical trial of semaglutide found reductions in alcohol consumed during a laboratory test, drinks per drinking day and alcohol cravings, although the trial involved only 48 participants and the authors explicitly called for larger studies. A much larger observational study also found reductions in reported alcohol consumption among many people receiving anti-obesity medication.
It is much too early to translate this into a Metcash earnings forecast. But if GLP-1 use becomes widespread, reduced alcohol consumption could become another structural pressure on an industry already dealing with changing drinking habits and health consciousness.
Can Metcash continue growing liquor earnings even if Australians drink less? Its independent network has been gaining share, and convenience, price/mix, locally tailored ranges and on-premise distribution can allow Metcash to grow even in a relatively flat underlying market. GLP-1 is therefore worth watching, but at this stage it is better thought of as a long-term industry question than an immediate earnings problem.
How inflation works for a wholesaler
A wholesaler earns its margin on the price of the goods it moves. When supplier prices rise, the same margin applies to a bigger dollar base, so gross profit rises with little extra work. Stock bought before a price rise and sold after it adds a further boost. Cost-of-living pressure also tends to push shoppers toward smaller, more frequent trips to local stores.
The current cycle is less straightforward. Metcash’s wholesale price inflation is running at only about 1.5%, while wages and freight are rising faster. This is why margins are under short-term pressure. Historically, supplier prices catch up with input costs, and Metcash benefits when they do. A $25 million cost-out program helps bridge the gap in the meantime.
Hardware is where the inflation benefit is already showing. ABS producer price data shows pipe and polymer products up about 12% over the year to June 2026, electrical wiring prices rising, and timber frame and truss prices, Metcash’s largest hardware exposure, up 3.4%. Higher prices lift hardware sales even while construction volumes stay weak.
Metcash’s reporting calendar
One easy-to-overlook feature of Metcash is its reporting calendar. Most ASX companies balance their books on 30 June and report in the busy February and August seasons. Metcash’s financial year ends on 30 April. Its full-year result arrives in late June, its first-half result, covering May to October, is due on 1 December, and it gives a trading update at its AGM in early September.
This has a few practical effects for investors. First, Metcash reports when the market is quiet, so its results tend to get more attention and are often read as an early signal of independent retail and household spending. Second, its numbers cover different months from its peers. Coles, Woolworths and Wesfarmers reported in August on the year to June, while Metcash’s AGM update in September already covered trading through to August. Third, long gaps can exist between hard data points. After the September update, the next full picture comes in December.
The September update was encouraging on sales. Group sales rose 3.5% in the first 18 weeks of FY27, ahead of market expectations. Supermarket sales outside tobacco picked up through the period, tobacco returned to growth, and hardware continued to build momentum.
The message on costs was more cautious. Wage and freight inflation is running ahead of price inflation in Food and Liquor, and the first half carries a roughly $10 million hit from the end of an earlier tobacco excise boost. Analysts trimmed their earnings forecasts as a result. Put simply, the top line is doing its job, and the focus is now on margins.
Why the price-to-sales ratio is so low
Metcash’s price-to-sales ratio is about 0.18 times, which looks extraordinarily cheap. Much of this is structural. Reported revenue includes more than $2 billion of goods invoiced directly by suppliers and passed through Metcash’s books at almost no margin. It also includes tobacco, whose price is mostly excise. And the independent store owner, not Metcash, keeps the retail margin. As a result, Metcash earns roughly 2.6 cents of operating profit on each dollar of revenue.
Why the price-to-earnings ratio is low
On earnings, Metcash trades on about 11–12 times, a large discount to the broader industrial market. The market is pricing in several concerns: competition from Coles, Woolworths and Aldi, the hardware cycle, and the current squeeze from cost inflation. Some of these are real. Taken together, though, the market is treating Metcash as a low-growth wholesaler in decline, and the business is showing otherwise. Food earnings rose 5.4% in FY26, the price gap between IGA and the majors has narrowed, liquor market share keeps edging up, and tobacco sales have returned to growth on the illicit-trade crackdown and new contracts.
Metcash has always traded at a discount to the supermarket majors. Its P/E has sat between about 10 and 17 times since 2018, while Coles and Woolworths have mostly traded between 20 and 30 times. Market estimates put the discount to Woolworths at about 45%, in line with its five-year average. Within its own range, Metcash is near the low end. History also shows its P/E tends to rise when sales growth picks up. With sales now accelerating, that relationship works in its favour.
Metcash’s valuation over time
The chart below shows how the market’s view of Metcash has changed over the past five years. In FY22, when local shopping and home renovation were booming after COVID, Metcash traded on almost 19 times earnings and about 0.3 times sales. Since then, both measures have roughly halved. The share price now sits on about 11 times earnings, below its ten-year median of about 14 times, and on less than 0.2 times sales.
Notably, the business has not shrunk over that period. Revenue has grown from about $15 billion to more than $17 billion, the company has added foodservice and more hardware, and the dividend has stayed in an 18–20 cent range. Most of the fall comes from the multiple the market is willing to pay, not from the business itself. In our view, that leaves room for a share price recovery as margins improve and the hardware cycle turns.
Metcash price/earnings and price/sales, FY22 to now
Price / earnings
Times10-year median P/E ≈ 14×
Price / sales
TimesSeparate scale · no P/S median supplied
21 September 2026 · P/E 11.2× · Price / sales 0.18×
“Now” is the source observation on 21 September 2026, not a live price.
View supplied chart values
| Period | Price / earnings (times) | Price / sales (times) |
|---|---|---|
| FY22 | 18.9 | 0.31 |
| FY23 | 14.5 | 0.24 |
| FY24 | 16.7 | 0.27 |
| FY25 | 12.5 | 0.20 |
| FY26 | 10.7 | 0.17 |
| Now — 21 September 2026 | 11.2 | 0.18 |
Our valuation of Metcash (circa $3.80 per share) would represent a P/E of 14.9x and a price to sales of 0.24, neither substantially different from the median values shown in the chart above.
What to look for on 1 December
The half-year result is the next chance to see how Metcash is handling the squeeze between prices and costs. The points we will be watching are:
- Margins in Food and Liquor: how much cost inflation has come through, and whether supplier price rises have started to catch up.
- Cost-out progress: delivery against the $25 million savings program, and any sign of further savings.
- Hardware: whether sales momentum is turning into better margins, and early signs of a housing recovery.
- Tobacco: whether the recovery in volumes from the illicit-trade crackdown holds up.
- Liquor customers: how well Metcash holds its wholesale customers against a newly well-funded competitor, Paramount Liquor.
- Store ownership: how many IGA stores have been bought, at what price, and how they are performing.
- The dividend: confirmation that the payout is being maintained, which strong cash flow and low debt should support.
We expect the first half to show margin pressure, as the AGM update flagged, so a softer earnings line would not surprise us. The more important signal is the direction into the second half and FY28.
A stock for the times
This is why we continue to like Metcash. In an environment of persistent inflation and higher interest rates, the qualities that matter most are the ones Metcash has:
- Essential demand: groceries, liquor and trade supplies are bought in good times and bad.
- Strong cash generation: operating cash flow was $558 million in FY26, ahead of reported profit.
- Low debt: borrowings are about 1.0 times earnings, at the bottom of its target range, which leaves room to fund store purchases and dividends.
- An attractive dividend: 18 cents fully franked, a yield of about 6% in cash, or close to 9% grossed up. That is roughly double the cash rate.
- Built-in recovery options: a housing upturn for hardware, supplier price pass-through, and the benefits of cost-out and store ownership.
Near-term margins may stay under pressure while costs outpace prices. But the core of the business is sound, and the shares already reflect a cautious outlook. Metcash won’t grow at a blistering pace, and it doesn’t need to. For investors who value resilience, cash flow and income, it remains a stock for the times.
Past performance is not a reliable indicator of future performance.
No assurance or guarantee is given that any forecast, target or projection will be achieved.
Any advice contained on this website is of a general nature only and has been prepared without taking into account your personal objectives, financial situation or needs. Because of that, before acting on any advice on this website, you should consider whether the advice is appropriate for you having regard to your objectives, financial situation and needs.