
Copyright 2025 First Samuel Limited
Read last week’s Investment Matters.
The Market
Unemployment rate unchanged, but there’s a back story
This week, a new set of ABS Labour Force data was added to the plethora of economic data released in recent weeks. Once again, the impact on RBA interest rate decisions was to the fore.
This month, the unemployment rate held steady at 4.3%, but the number of people working fell by 21,000.
So what happened?
The monthly Labour Force series, which produces the much-watched employment growth and unemployment rate statistics that make the headlines, is both volatile and a little misunderstood.
Understanding the data
Being survey-based, it can suffer from problems of sampling design, that is, who gets the surveys. But these issues are smoothed out over time. The actual difficulty lay in constructing some of the outputs, especially employment growth, expressed as the number of jobs added to the economy.
Consider the following path to the estimate:
- The first estimate is the population growth itself, which, because there are different bases for determining whether a person is counted in the population, versus whether or not they have the right to work, is very problematic.
- The second is whether or not the person in the survey is in the labour force itself.
- The third is whether or not the activities undertaken are considered working, looking for work or otherwise.
[The ABS definition of ’employed’ is anyone aged 15+ who worked one hour or more for pay, profit, commission, or payment-in-kind during the reference week, or worked without pay in a family business, or had a job but were temporarily absent. This “one-hour rule” is an international standard for comparable employment figures, capturing all paid work, even if minimal.]
Together working (by ABS definition) and looking for work forms the participation rate – the black line in the Figure below. As more women entered the workforce, as part-time work and childcare made it easier to work, and as older Australians (55+) worked longer than previous cohorts, the participation rate has steadily increased since 2000 (figure #1 below)
Figure #1: Australian participation rate and employment to population ratio
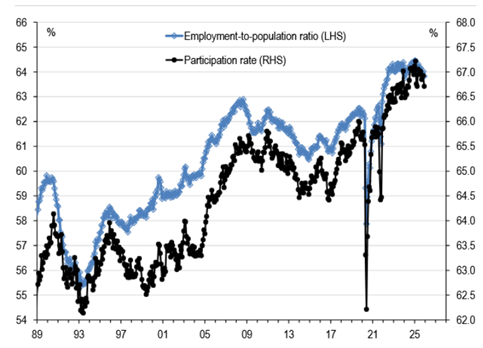
Source: UBS, ABS, Macrobond
With the “participation rate” multiplied by the population estimate serving as the pool of available workers based on the survey, and that pool changing along with the level of employment itself, we can sometimes see mixed month-to-month results.
This month, the unemployment rate held steady at 4.3%, but the number of people working fell by 21,000.
So what happened? The pool of participants declined despite population growth at elevated levels -participation rate fell by so much that it counteracted the population growth, and the fact that the share of unemployed surveyed stayed the same.
Over the long run, changes in participation are fundamental, as shown in the above table, but short-term volatility is less likely to be so.
Market participants understand these nuances better than headlines, so what are the medium-term trends?
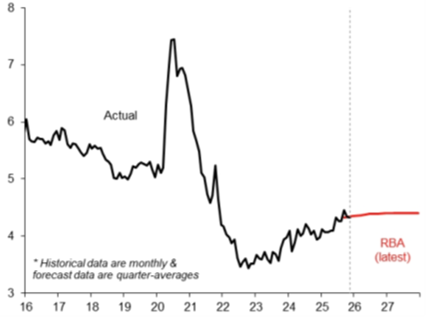
Unemployment is slowly rising and is expected to continue to do so, but from low levels. In our minds, this is consistent with the excess population growth we are currently enduring.
Figure #2: Australian unemployment rate and RBA forecasts, % of labour force
Despite the slowly rising unemployment rate, there is little slack in the labour market, nor is there much job creation. Softer measures of underemployment, such as “underemployment”, where those employed would like to work more, are not elevated. Under-utilisation isn’t rising appreciably either.
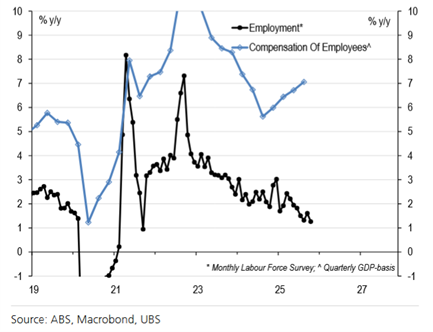
All suggest that there should be some pressure on wage growth and sustained underlying pressure on inflation to remain above the RBA’s comfort level. The best evidence of the tension in the labour market is shown in the figure below, which compares the slowing rate of employment growth with the rising rate of total wages growth in the economy (“Compensation of Employees”). The gap is either higher wage rates, more hours or a difference of opinion on employment.
Whilst each measure is constructed in a slightly different manner, the trend is relevant. Either employment growth in the ABS Labour Force is understated (likely in our view) or wage pressure is higher than appreciated.
Figure #3: Australian unemployment rate and RBA forecasts, % of labour force
Our view is that wage growth remains muted, but inflation pressures persist. Over the next 12 months, the RBA appears to require more data to confirm whether inflationary pressure will ease again. The ABS Labour Force release and each of its components will provide critical insight into such trends each month.

Emeco: Beyond NTA (Net Tangible Assets)
In the vernacular, Emeco owns and rents out big yellow trucks. Readers will recall that it has been a long-held and profitable position in clients’ Australian equities sub-portfolios, delivering capital goods on a hire basis to the mining industry.
In August, in Investment Matters, we wrote a piece concerning a long-held position in Emeco Holdings. It was titled, “Emeco Holdings (EHL): Delivering toward NTA (Net Tangible Assets) and beyond?” Read it here.
In that piece, we discussed the limited reasons why the company should be trading at a discount to its net asset value (around $1.30 per share). Whilst in the past, factors that could lead to a discounted share price existed, they are no longer relevant, and with a strong outlook for cash flow generation, as noted in August.
“There are no limits to the stock trading at or above its NTA, of at least $1.30 per share, if not higher.”
Pleasingly, the stock has indeed traded 20% to 30% higher since August, with the current share price approaching the NTA figure. The company has continued to execute well, recommit to its FY26 earnings guidance, and has also made improvements to its financing in recent weeks. We look forward to the benefits of this debt reorganisation over the next 6-12 months.
But this was only part of the story. The second half of the article in August talked about how Emeco should and could trade “at levels above NTA, as it adds value beyond simply owning the assets. Value includes its ability to repair equipment, a service it provides to internal and external customers at its Force Workshops”
We also said that in the medium term, “Emeco may generate additional value through its advanced technology strategy, including …… telemetry and analytics”.
Emeco is much more than a Rental Business
So, with that context, we were excited by the company’s Investor Day held this week and by analysts’ reaction to the information presented. The presentation was titled “The Force behind Emeco: Our Asset Management & Maintenance Services Story”. We loved the presentation.
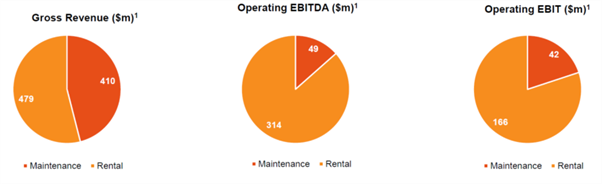
What did they say? Our interpretation was that Emeco emphasised its core identity as a balanced service and rental provider. A significant 46% of its revenue—about $50m in Operating EBITDA—stems from maintenance and workshop services, not just equipment hire.

This segment represents a strategic growth area, offering high-margin, low-capital-intensity earnings. Driven by a 23% compound annual revenue growth rate over the past 3 years, the company meets customer demand for bundled solutions. Emeco provides integrated equipment rental, maintenance services, and advanced asset management technology through its dedicated Force business and fully maintained rental options, diversifying its earnings and strengthening customer relationships.
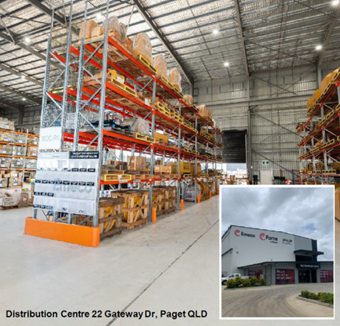
The Force Workshops are located across Perth, the WA goldfields, the Pilbara iron ore belt, Brisbane, and the northern coalfield of Queensland. These workshops perform repairs and complete rebuild services – stripping machines back to chassis or tailoring repairs. At the parts level, Emeco can strip back implements and attachments, identify wear and torsion issues, and improve decision-making.
The company also provides nationwide field service, including the technical personnel required to deliver it. Another element we didn’t appreciate was the company’s extensive parts distribution business. This national network improves response times for unplanned maintenance events, consolidates part supply to support continuous operations, and uses advanced reporting tools to enhance supply precision. These elements are difficult to replicate for smaller miners or niche industries adjacent to mining.
Figure #4: Parts distribution and information collection – underappreciated capacity
Source: Emeco Investor Day Presentation, Dec 2025
The following figure, provided by the company at the Investor Day, breaks the company’s overall operating metrics into Maintenance and Rental.
Figure #5: Medium-term financials, free cash flow (LHS, $m) and margins (RHS).
Source: Emeco Investor Day Presentation, Dec 2025
For valuation purposes, it is critical to break a business down into its components, especially if these parts are growing at different rates, have different capital requirements, are more or less affected by the mining investment cycle, and have higher or lower margins.
The maintenance and services business within Emeco is both faster-growing, less capital-intensive, less cyclical, and higher-margin. This combination means that, all things equal, this part of the business is worth more per dollar of profit (a higher multiple).
The flipside of higher multiples in the Maintenance segment is potentially a lower multiple for the Rental business, especially if it is too indebted or the costs attributable to the Rental business partially support maintenance services. So, for four or five years, the distinction was moot; the company’s overall excess leverage and lack of operating cash flow made it impossible to distinguish between the two enterprises for valuation purposes accurately. But now that operating cash flow remains strong and balance-sheet leverage has improved (debt has been reduced), the company has the capacity to choose between areas of future growth and investment thoughtfully.
We had always accounted for the company in a way that provided some differentiation among business units. Still, the differences gleaned from past accounts were not as impressive as shown in this presentation. Indeed, our assessment of the company over the past few years was that it could unlock value through the sale of the Force Workshops (the majority of the newly detailed Maintenance segment).
Positioning Emeco for the next 10 years
The final leg of the growth options presented included the monetisation of data Emeco collects and processes as part of its operations. This information ultimately assists with the care, maintenance and efficient use of costly equipment. In the long run, many miners, especially smaller operations, are likely to view companies such as Emeco and other technology partners as the best operators, if not the sole providers, of mining equipment.
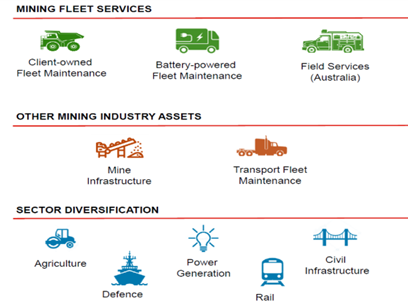
Positioning the company as a provider of value-added services, not just equipment, also places Emeco within a sphere of companies that can deliver improved mining fleet services (including electrification), and allows it to branch further into adjacent areas that require equipment.
The sources of future growth in these areas were also not well understood by the market, nor was it previously clear that the company would pursue M&A to expand in them.
Figure #6: Multiple avenues to grow maintenance services organically and via M&A
Source: Emeco Investor Day Presentation, Dec 2025
After all, even minor improvements in availability, clearer maintenance sequencing to reduce disruptions, and increases in equipment’s useful life can significantly add to a mine’s long-term profitability.
Following the presentation, several market analysts raised their target prices and scope for additional contribution to revenue growth and profits that the Maintenance division may provide in the future.
Summary
- Emeco’s balance improvement, delivery on guidance and strong cash flow have driven the share price that reflects the value of the equipment asset it owns (NTA). The share price has risen substantially over the past 18 months.
- Now the company needs to position for growth and elucidate to the market why its accompanying services and maintenance business adds value on top of the underlying assets, not just as a support to their value (“beyond NTA”).
- The investor day provided not only additional clarity on the size and scope of the services offered, but it also provided information that the market may use to value its growth and underlying earnings quality more highly
- The company implicitly also outlined a new direction in the way it is likely to grow in the future. For existing shareholders, this presents exciting new optionality.
The information in this article is of a general nature and does not take into consideration your personal objectives, financial situation or needs. Before acting on any of this information, you should consider whether it is appropriate for your personal circumstances and seek personal financial advice.