
Copyright 2025 First Samuel Limited
Read the previous week’s Investment Matters.
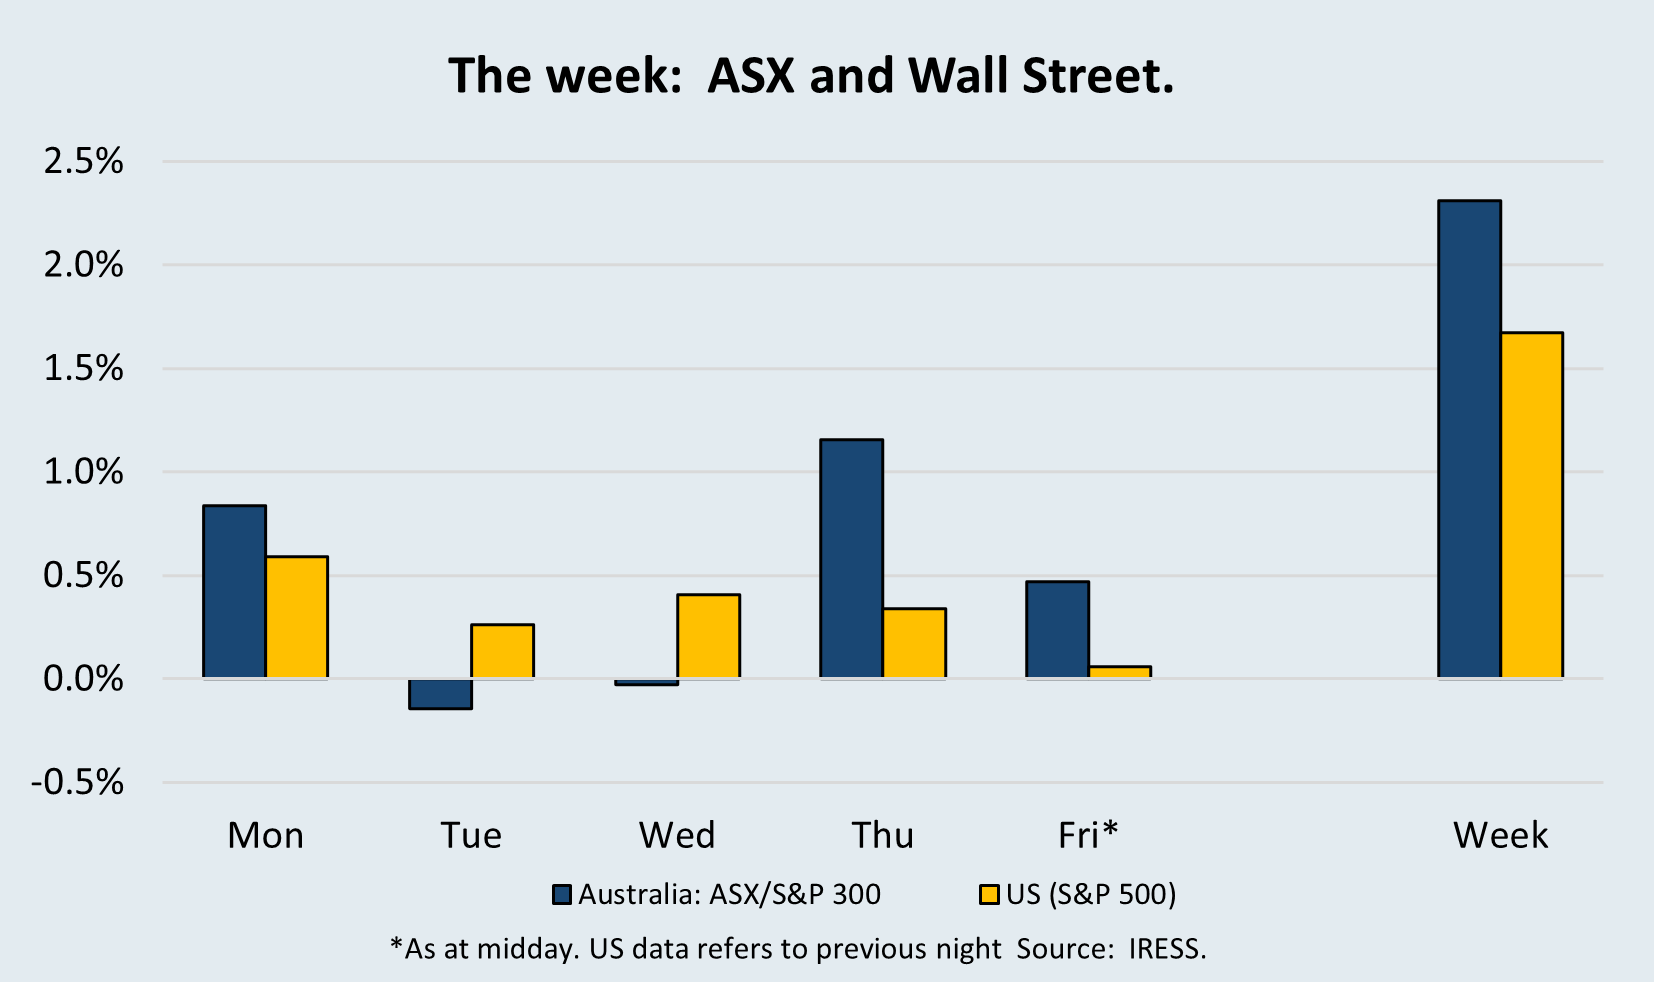
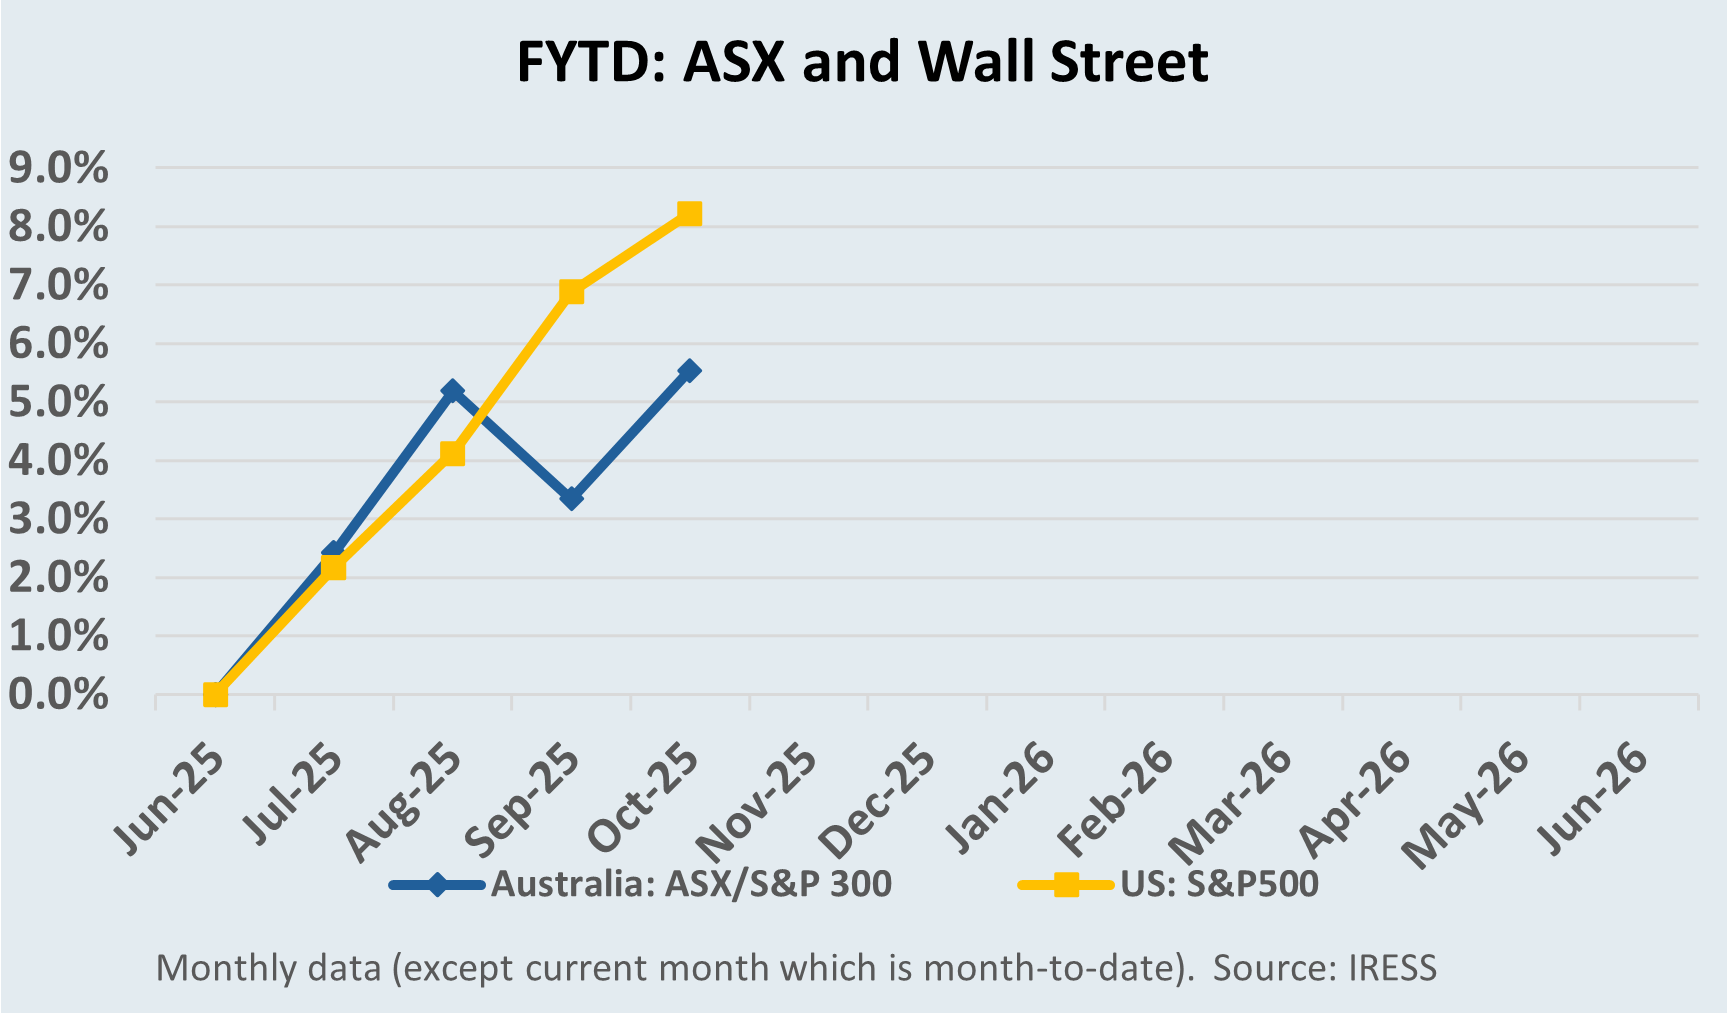
The Market
September CPI: A Warning Signal for Markets, Housing, and Policy
The September CPI print has shifted the narrative surrounding monetary policy in Australia. While global inflation has shown tentative signs of moderation, the Australian experience highlights the structural persistence of price pressures in ‘non-tradable’ (i.e. services, utilities, and administration) goods and services.
This is critical because non-tradables represent the most domestically driven component of inflation, are deeply connected to labour market conditions, administered prices, and sectoral concentration, and are the least responsive to monetary easing.
Meanwhile, the RBA faces the impossible task of using a single interest rate to balance diverging household outcomes, inflated housing prices, and ongoing global uncertainty.
Regular readers of Investment Matters will recall that we are positioned for persistent inflation.
The chart below shows how the market for future interest rates responded between the 16th of September and the end of the month, 30th of September, following the CPI data release and RBA commentary. Markets suggest at least one less, 0.25% rate cut across the next 18 months.
Figure #1: Changing outlook for rates – heavily influenced by inflation data
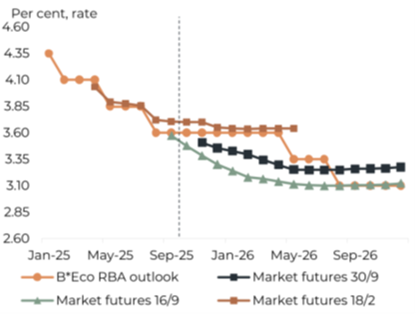
Source: RBA, Bloomberg, Barrenjoey Research Estimates
This is an important change for ASX stocks as much of the recent exuberance has been built on expectations of ongoing rate cuts.
So, what changed?
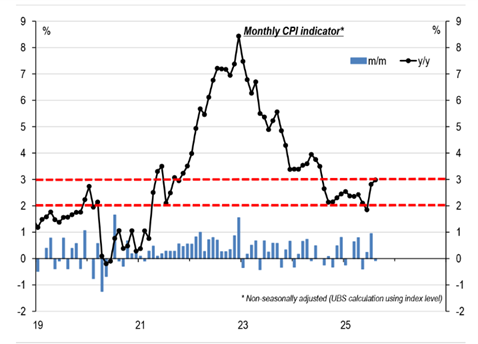
CPI surprises on the upside
CPI surprised to the upside in August, driven not by volatile categories like electricity or travel, but by broad-based increases across the basket. Economists warn this is a clear signal of re-accelerating inflationary pressures.
Figure #2: September FOMC Dot Plot – plus Trump and Miran
Source: ABS, UBS
In the short term, markets still expect further cuts; however, the long-term risk is that central bank independence will be eroded if the RBA is forced to accommodate political demands while inflation proves to be sticky.
As one economist from Barrenjoey noted:
“The August Monthly CPI Indicator is flashing warning signals for the RBA, showing broad-based re-acceleration in inflationary pressures. Indeed, the volatile items such as electricity and travel were largely as we expected for August, but there were material upside surprises across much of the basket.”
The immediate policy implication is that further cuts may be deferred. Market expectations of sequential easing may prove too optimistic if the RBA interprets these signals as evidence that inflation is becoming entrenched.
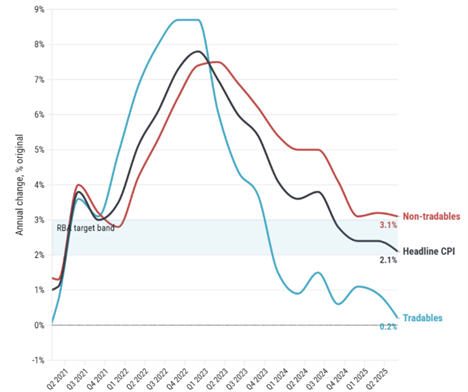
Non-tradable inflation returns
Services, utilities, and administered prices continue to rise. Unlike tradables, which benefit from global competition and cheap imports, non-tradables are heavily influenced by domestic wages, regulation, and market concentration. This makes them far harder to suppress with monetary policy alone.
Figure #3: Non-tradeable inflation has rebounded

Source: FOMC, CNBC
The re-acceleration in non-tradable inflation raises three key concerns.
First, it raises the question of whether the Reserve Bank of Australia (RBA) has already erred by cutting rates too quickly in 2025.
Second, it reinforces the risk that dwelling prices will rise at a pace inconsistent with long-term household income growth, raising the prospect of a housing “up-crash” driven by speculative demand.
Third, it highlights the limitations of relying on monetary policy in a policy vacuum where structural reform is absent and fiscal levers are underutilised.
Housing: from recovery to “up-crash” risk
The RBA first cut the cash rate in February 2025. Since March, dwelling prices have risen at an annualised pace of ~7%. In September, year-on-year growth hit 4.8%, the fastest since 2024.
This acceleration risks becoming self-reinforcing: expectations of higher prices drive demand, which in turn drives prices—a dynamic often referred to as a Giffen good in economic theory. In Australia, this has been more popularly described as “FOMO”—Fear Of Missing Out.
Housing policy context:
- The expansion of the First Home Buyer Scheme in October 2025 adds further fuel to demand.
- Unlike earlier cycles, housing supply remains constrained by planning bottlenecks and rising construction costs.
- Structural demand pressures from migration further exacerbate the imbalance.
The danger, as described by UBS economist George Tharenou, is an “up-crash,” where momentum becomes detached from fundamentals, amplifying financial stability risks.
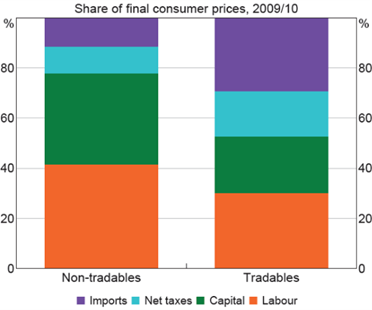
Non-tradable Inflation in Theory
The RBA’s 2014 Bulletin paper “The Determinants of Non-tradables Inflation” provided a framework that remains useful today. It distinguished between:
- Tradable goods and services, influenced by global competition and exchange rate movements.
- Non-tradables, heavily reliant on domestic capacity, labour, and administered pricing.
Figure #4: Drilling at Bullabulling
Source: ABS, RBA
Non-tradables require significantly higher domestic labour and capital inputs.
Non-tradables also include what is referred to as administered items: those for which prices are (at least partly) regulated or for which the public sector is a significant provider. This includes administered services, such as health, education and childcare, as well as utilities.
Therefore, inflation for non-tradable items should provide a relatively good sense of the extent to which demand exceeds (or falls short) of supply in the domestic economy.
The structural story since the early 2000s has been straightforward: globalisation, particularly the integration of China into world trade, depressed tradable inflation. Non-tradables, by contrast, reflected domestic bottlenecks in supply, productivity shortfalls, and rising unit labour costs.
Figure #5: Tradable vs non-tradable inflation

Source: ABS, RBA
Persistent divergence between tradables and non-tradables has characterised Australian inflation dynamics for two decades. The paper helped explain why, in 2014, we had already seen a decade of differences in relatively high non-tradable inflation and relatively low tradable inflation. The differences in the decade since the paper have continued to see a wide gap.
Looking at the average rate of inflation since 1998, we see that
- Tradable inflation has averaged 1.6% per year
- Non-tradable inflation has an average of 3.6% per year
It is only the contribution of externally driven tradable deflation that has placed overall inflation within the target range of 2-3% that the RBA has utilised.
In our view, part of the reason Australia has driven household debt to record levels is that interest rates have been consistently too low since 1998. This proved beneficial for an entire generation of Australians through high asset prices, but ultimately proved a headache for growth and new asset formation for future generations.
However, these effects could be easily mitigated by a strong reform agenda, a point noted by both the left and the right of the political spectrum. Politicians of all ilk have demonstrated no appetite for reform in the past 20 years so, instead, we are forced to return to the RBA and its reliance on a single variable, despite two almost independent drivers of inflation.
What concerns your author the most is the lack of action. On the right, the Australian Industry Group (AI Group) noted in its commentary earlier in the year that
“All inflation progress in 2025 has been attributable to tradables; non-tradables have not budged. This implies that without structural reform, the RBA’s 2–3% target will remain under constant threat.”
The chart they produced had not shown the reversal in trends of non-tradable we have seen in recent months, but the side-by-side comparison in the chart below highlights just obvious this problem is.
Figure #6: AI Group – Progress in lowering inflation in 2025 driven by traded products
Source: ABS, AI Group Research & Economics
The reversal in fortunes that has now seen the red line turn upward again only reinforces the need for structural change in our economy.
In July the AI Group noted, ”the data also reveals that domestic-origin inflation remains too high, with no progress in lowering non-tradable prices growth this year. High wages growth, a very tight labour market, and rising energy and regulatory costs continue to pose a challenge for industry and the economy at large.
This is ultimately a symptom of Australia’s weak productivity performance – absent of meaningful productivity uplifts, rising business costs will be passed on to consumers and stoke inflation. Without productivity gains at home, we will rely on the global economy and cheap imports to manage inflation for us.”
These were the views of business, and views from the left highlighted how easily business can pass through higher costs in the Australian economy. The duopolistic and concentrated nature of most businesses means that in Australia, higher prices rarely lead to lower profits, where businesses absorb some of the increase. Rather, higher prices lead to higher profits, which in turn result in higher prices, a phenomenon some have referred to as a “profit-price spiral”. This concept is rooted in historical analysis that noted the existence of wage-price spirals in the 1980s, when labour was more heavily unionised.
Less political but equally concerned with policy, we have seen people question the ongoing feasibility of the 2% target. More extreme weather events, moves to decarbonise the economy, improving struggling or failing infrastructure, wars, and geopolitical tensions are all inflationary, and to the extent that these effects require more support for indebted households, the case is built to target monetary policy towards higher inflation levels.
Aren’t we missing something – of course, we are.
Population growth through migration is the jet fuel for non-tradable inflation.
Adding high population growth to an economy with a poor industry structure, weak control over administered prices and higher returns to capital than labour, almost guarantees non-tradable inflation.
Pressure on housing costs, even though house prices are not included in the CPI measures, is driven by population growth, particularly in the absence of a reform agenda that would lead to an improved supply of housing and land.
Without structural reform of industries with excessive concentration or profits, such as banking and insurance, a high population actually consolidates its position.
With strong population growth, we can witness periods of excess demand despite relatively weak conditions in the household sector, as industry focuses on pure growth in numbers, without the need to drive productivity growth or new investment.
This is the circumstance we see in 2025.
Migration has slowed, but nowhere near enough to be a considerable headwind for population growth. The labour market has remained steady, thanks in part to ALP policy supporting employment in healthcare and aged care, although this may be changing.
Policy desert?
A recurring theme is the absence of a comprehensive reform agenda. Despite holding a strong parliamentary majority, the government has deferred to the RBA, relying on a single policy instrument: the cash rate.
This creates what might be described as a policy desert—a void in which monetary policy must simultaneously address long-term productivity challenges, intergenerational inequality, and global shocks.
Governor Bullock’s recent remarks highlight the narrowing space for monetary policy. Policy has shifted in description from “somewhat restrictive” to “a little bit restrictive,” but the three cuts delivered in 2025 have already reignited housing inflation.
The limitations of a single instrument applied to heterogeneous households are stark:
- For asset owners, cuts drive wealth effects through housing, equities, and superannuation.
- For renters and heavily indebted households, cuts do little to offset higher living costs.
- For younger households, the combination of higher house prices, limited real income growth, and overstretched services creates a structural disadvantage.
Portfolio impacts
Investing is always a task of balancing the risks of reform and change with finding opportunities within the current landscape. In late 2025 the risks of reform are low.
As such persistent inflation, weak productivity, and policy paralysis continue to shape positioning:
- Avoid – banks and consumer discretionary, which remain vulnerable to cost pressures and softening demand.
- Prefer – gold and technology, sectors with asymmetric upside from uncertainty and structural growth.
- Strategic assets – companies holding hard or inflation-linked assets.
- Cash – elevated balances are maintained, reflecting expensive valuations and the potential for market correction.
This positioning has proven profitable in the early months of FY26.
The information in this article is of a general nature and does not take into consideration your personal objectives, financial situation or needs. Before acting on any of this information, you should consider whether it is appropriate for your personal circumstances and seek personal financial advice.