
Read the previous week’s Investment matters.
Photo © vladimirsukhachev from Via Canva.com
Copyright 2025 First Samuel Limited
The Market
Final week
The semi-annual company profit reporting period concluded today, with some laggards reporting as we write and others providing excuses for late entries next week. Combined with some key results from QBE Insurance and Inghams Group last Friday, we received updates from almost 30% of stocks held in clients’ Australian shares sub-portfolios.
Along with the individual results, some background to the reporting season is required for context.
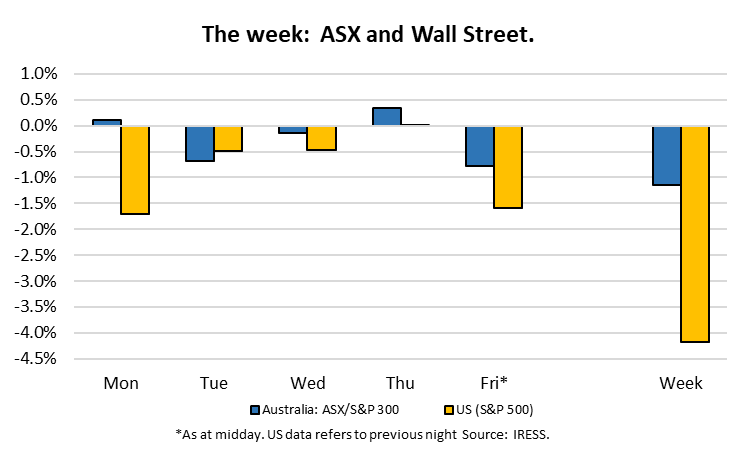
The market is down almost 3% in February. Partly due to the results reported, and partly due to some extreme share market pricing leading into February, we have seen the following trends:
- Sell downs (lower prices) in higher momentum names;
- Switch away from expensive banking stocks after lacklustre updates in recent weeks and appreciation of weak earnings growth from the bank sector as a whole; and
- Large swings in the prices of stocks on the day of reporting has provided some opportunities for trading clients’ positions.
Overall, this was a very successful reporting season for our portfolio holdings in aggregate. The market’s renewed focus on value, returning to earnings growth and cash flows as the principal drivers of the company’s success was welcomed.
As we have done in previous weeks of Investment Matters, we have included a table (below) of the portfolio companies reporting and brief notes on each.
This week’s Investment Matters discussion will concentrate on three significant holdings: QBE Insurance, Inghams Group and nib Insurance. After the reporting season, we will provide more details on the remaining core equities’ positions.


Inghams Group (ING): Disproving the doubters has provided an opportunity
A top 10 position in clients’ Australia Equities sub-portfolios, Ingham’s is the largest integrated poultry producer across Australia and New Zealand. It supplies chicken, turkey, and other protein products to retail, quick service restaurants (including KFC), food-service distributors, and wholesale and export channels.
Last Friday, Inghams Group provided a pleasing update that addressed the market’s concerns of the previous 6 months. In August 2024, we learnt that Woolworths had diversified some of its supply away from Inghams to other providers. The risk for Inghams was that despite Woolworths’ demand reductions being tapered across 2025, Inghams would not be able to find new buyers for the production, and that excess supply would result in lower prices.
The operating results and management commentary proved otherwise, noting the company has successfully navigated diversifying its customer portfolio. New business was secured equivalent to ~75% of expected Woolworth’s volume reduction due to new supply agreement. At the same time, retail volumes were up 3.1% and net selling prices (NSP) were up 1.7% on the previous year and flat on the prior period.
The stock was rewarded by a 5% increase through the week.
This is the third time in three years the market’s concerns around industry pricing have proven unfounded. Clients will be aware that we first built a position in early 2022, when the share price was in the low $3 range, a price that was significantly discounted both the historical trading levels and our long-term valuation. The market was concerned about the ability of Inghams to respond to feed cost inflation and other inflationary trends in the economy.
Inghams Group core poultry pricing

Source: Company reports, MST Marquee.
We thought these concerns were dramatically overstated, noting that Australia’s chicken meat industry structure is highly concentrated and historically well-behaved. Subsequently, 2023 saw significant pricing inflation. The chart above shows the price trends upward march.
We remain confident that the chicken meat industry retains structural tailwinds that support volume and price growth over the medium term.
Another issue garnering attention at Inghams is the new strains of bird flu. Although Inghams has been relatively unaffected, the possibility of an impact is high, but the degree to which outbreaks remain geographically isolated, and hence financially contained, is vital to consider.
It is also essential to consider the dramatic difference between the impact of bird flu on egg-producing hens and chicken for meat production. The loss of egg-producing hens impacts the supply chain for 12 months as chickens need to mature to egg producers. Chicken meat on the other hand, has a turnaround of no more than 2 months.

The impact on egg pricing has been dramatic in the US, where bird flu is much more prevalent. The implications for chicken meat pricing and supply have been much more contained. Indeed, chicken meat pricing has continued to rise moderately without significant supply issues.
1H25 Results
Inghams met market expectations for earnings in 1H25 and reiterated its guidance for FY25 financial returns.
There are many moving parts in a business like Inghams, even without supply chain changes. With the addition of the Woolworths disruption (negative for profits), lumpy demand, improving feed costs (dramatically positive), and uncertainty regarding customer preferences by channel type, landing on a final earnings estimate can be difficult for management teams. The implied confidence from Inghams reiterating guidance was crucial.
The Woolworths’ supplier changes are not the only underlying challenges for Inghams. FY25 core poultry volume outlook also deals with the effect of consumer cost of-living pressures on out-of-home channel demand. We remain concerned about the rapidly diminishing value proposition of a range of out-of-home chicken offerings, especially at KFC and Guzman y Gomez.
The long-run impact of a shift between Retail (supermarket), QSR (quick service like KFC) and wholesale (including both consumer direct and food service), can impact Inghams’ net selling prices. Competition, or lack thereof, within each segment also plays a role.
Improving feed cost will remain a tailwind through the second half of FY25 and into 2026. The excellent chart below from Macquarie Research shows the relationship between Chicken Feed Index (inverted, in yellow) and the Inghams (ING) share price (blue line). The Chicken Feed index is inverted, meaning that when feed is cheaper, the yellow line is higher, Inghams is more profitable, and we would expect its share price to be higher. When feed is expensive, the yellow line is lower, Inghams is less profitable, and we would expect the share price to be lower. Note that in 2022, the very high feed costs (Ukraine war commenced and wheat and fertiliser prices increased) resulted in a significant fall in Inghams’ share price, providing First Samuel clients with a buying opportunity.
Inghams share price and the cost of feed

Source: Macquarie Research (Feb 2025), Factset, Company reports.
The improvement in feed cost through 2023 extended to drive the Inghams share price above $4 per share, a level at which we reduced our holdings by 40%. The stumble in price associated with the Woolworths’ supply change allowed us to rebuild our position at lower prices.
It is worth noting that performance in New Zealand (20% of the business and slightly higher percentage of our valuation) was below our expectations. This has been a consistent thematic for companies with operations in NZ. Operating earnings, EBITDA, were nearly 10% below our expectations.
Management suggested that the mix between the type of channels chicken was sold played a role, and the team are otherwise happy, however, we are more concerned. This will be a critical topic of our discussion with the management team this week. Margins in the second half must improve, and evidence of higher margin from product mix is required.
Impact on valuation
Our valuation is down slightly due to New Zealand’s weakness. The Australian business has coped well with the current adversity, and we are more confident in our valuation than before the result.
With the current share price only reaching the mid-$3 range this week, upside remains even on a through the cycle basis. Considering the company’s strong execution, and outlook for feed costs, considerable upside remains at current levels.
QBE Insurance (QBE): FY24 Full year results
The long-held, large position clients own in QBE Insurance has also been amongst the most profitable. Since February 2022, the total returns to the position have been more than 90%, more than 3 times the market’s growth.
The attractive returns achieved by the company have been more than matched by the scale of improvements in the underlying business and the quality of the company’s earnings. Insurance at the global scale that QBE operates, is very complicated and relies on a range of skills, including:
a) the capacity to generate accurate pricing of policies,
b) the ability to invest insurance clients’ funds,
c) the ability to manage tail risks, especially those related to catastrophes (CATs), including earthquakes, fires, hurricanes, etc. and;
d) Given QBE does not hold all the risks independently but rather judicially on-sells some of its risks each year, its ability to do this profitably
In addition, at the scale QBE operates it necessarily writes insurance across a vast range of insurance markets, with breadth in product and geography. Bringing this diversity together with an overarching operating system can be difficult, and over the more than 20 years I have covered the company there have been times when shortfalls in capability and diversity have disappointed investors. revenue effectively a function of number of ads multiplied by price, the impact on revenue should be clear.

Today, we see a combination of improved conditions and operational excellence underpinning:
- growth in insurance revenues, referred to as Gross Written Premium (GWP)
- structural reduction in volatility of earnings
- simplification of business lines
Macquarie’s analyst noted “QBE’s FY24 result highlighted further progress towards delivering stronger and more consistent profitability with clear momentum on this front visible out to FY26E.” We agree.
Next year, the FY25E Gross Written Premium (GWP) guidance for growth “around the mid-single digits” implies higher topline growth than current market expectations. Even more importantly for short-term price dynamics QBE’s exposure to slowing price increases was less than feared. The context for another year of expected GWP growth is the long-term chart since 2002 shown below.
QBE Group: Impressive GWP growth since 2002 following a decade of consolidation

Source: Company data, Barrenjoey Research
After consolidation in the business between 2013 and 2019, GWP revenue growth has become a dominant feature of the company’s performance.
Growth in GWP is the combination of growth in the number of policies written and price per policy (premium inflation). The premium inflation trends we have seen between 2020 and 2024 are moderating but remain strong.
QBE Group: Average premium inflation

Source: Company data, Barrenjoey Research
Aligned with the strong growth in GWP has been a stabilisation in the Insurance Margin, which despite the inherent uncertainty of insurance and catastrophic event, has been managed to a tight and improving range since 2020.
QBE Group: Insurance margin

Source: Company data, Barrenjoey Research
Market reaction to the results
The stock has traded strongly since before the result – up 7%.
In our view, the stock remains relatively cheap. In recent years, the prices the market is willing to pay for insurance earnings similar to QBE’s have been declining. Partly a global trend, and partly the result of growth in other areas of the market. The net result has still been a scenario in which the company has become relatively cheaper with respect to earnings, while having a share price that has dramatically outperformed.
Our long-term valuation remains more than the share price, and the relative discount to the overall market remains elevated (Figure 6 below).
Should management continue to deliver on guidance and manage short-term risks, the company is deserving of a higher PE. In the meantime, we see the reasonable yield, and undemanding multiple providing support.
QBE Group: PE Premium/discount to ASX200 (2yr fwd) since 2000

Source: FactSet, Barrenjoey Research
nib Insurance (NHF)
The combination of 1H25 financial results that met expectations and the much-awaited government announcement of future health insurance premium increases, buoyed the NHF share price this week.
By the end of Thursday, the stock was up 13%
Usually, an exceptional result is required to drive share prices higher. The context for this result was earnings upgrades; the company merely needed to reduce the risk of significant downgrades that many investors feared and were factored into the share price.
We felt the short-term risks were overplayed, and regardless the long run value was compelling.
Ultimately NHF delivered an in line 1H25 result and reiterated its profit guidance for the full year. With an adequate arhi (Australian Resident Health Insurance) premium rate approved, the foundations for reasonable performance in FY25/6 are now set. We still see a dramatic opportunity for efficiency benefits over time, perhaps more benefits than management and the industry currently appreciate. Embracing efficiency improvements will be important for industry and consumer outcomes.
The government’s premium rise, announced Wednesday, added to the uptick in the NHF share price. After lengthy negotiations between the Federal Government and insurers, health insurance premiums were announced to rise by an average of 3.73% from April. Subsequently NHF announced their premiums would rise on average by 5.79%.
As noted in previous Investment Matters and a recent CIO Monthly Video update, we have been looking for investment ideas relating to Australia health care funding solutions. With financial difficulties facing Healthscope and Ramsay, the spectre of ongoing cost inflation and an aging population, we expect hospital funding solutions to come from a mixture of increased premiums, changes to hospital operating costs, and some reform in service delivery.
The politically-tricky components included the premium increase announcement, especially in an election year. An industry-wide price rise of 3.73% represents a good middle ground and provides upside for a well-run business, like nib Insurance. With the private health insurance players part of the industry-wide solution, the opportunities for nib Insurance to benefit from ongoing reforms are still relevant and extend beyond premium price rises.
We were reminded in the presentation why we see NHF as an attractive vehicle to benefit from reform. Over and above some critical financial details, including balance sheet strength and operational momentum, the key for nib Insurance value creation has been the ability to grow its policy holders based more than market rates, and to do so at a higher level of gross margins (Figures 7 and 8, below). Since 2002 NHF has grown the number of policyholders by more than 200% versus industry growth of 60%.
NHF Policyholder growth since 2002

Source: Company data
Faster growth has been accompanied by improving gross profit per policy with a healthy gap now existing between the industry average and NHF’s performance.
This higher level of gross profit enabled NHF to continue to invest in new client acquisition, enhance its service offering, and leverage improvements in its cost of doing business.
Higher than industry profitability – Gross Profit per policy

Source: Company data
Additional businesses: Limited value?
In addition to the core business of domestic private health insurance, and insurance products to international non-residents, NHF has continued to develop a range of health services companies.
Innovation of this type is commendable. Innovation in product design, along with the identification of growing market segments, has been the key in the core health insurance.
The only problem is that innovation beyond the core does not appear to have created much value:
- Nib Travel Insurance generates limited returns despite almost $100m in premium written
- Nib Thrive is an NDIS plan management business, which, despite the growth in government funding to the sector, has only lost NHF money so far.
- Nib Health Services, which itself is an amalgam of Honeysuckle Health, Insurance services and Midnight Health (digital telemedicine platform)
While the returns have thus far not been considerable, we don’t note an improving level of profitability (i.e. reduced losses being incurred).
Health Services – ongoing losses

Source: Company data
Other smaller issues
There are some additional concerns we have with the business regarding the ongoing gap between underlying earnings and the actual amount of cash generated. Management was careful to note in this result that
“One-offs, M&A and integration costs continue to be elevated in 2H25 due to nib Thrive integration as well as Group wide productivity program including an organisational restructure. We expect these costs to reduce materially in FY26 … “
Whilst the plan to achieve such an outcome is critical, we are wary of companies with a weak stable of additional businesses, also having a range of “below the line” costs that ultimately either, obscure the real earnings power of the business, or obscure the true cost of the weaker parts of the business.
NHF still trades at a discount to the market
Despite the great outcomes NHF has achieved this week, we still see additional value accruing to the business.
Whilst relative price to earnings charts should not be the basis for investing (our long-term valuations are derived independently from such calculations), but the chart below nonetheless provides context to the relative sentiment the market has to the company or industry in question.
NHF still represents good value – PE premium/discount to ASX200 (12m fwd)

Source: FactSet, Barrenjoey Research
We can see that over the past year relative sentiment has been historically weak. We suspect that the combination of the result and ongoing industry funding solutions will provide an opportunity for additional share price growth.
The information in this article is of a general nature and does not take into consideration your personal objectives, financial situation or needs. Before acting on any of this information, you should consider whether it is appropriate for your personal circumstances and seek personal financial advice.