Copyright 2026 First Samuel Limited
Read the previous Investment Matters here.
In this week’s Investment Matters, we highlight a range of reporting season results and provide some commentary from meetings with management. The final week of reporting is often characterised by big moves and surprise results. However, this year, reality has been significant price variation across the board with the average stock movement of more than 10%.
This week, we continued to notice a trend that has persisted throughout February. While overall index levels have risen since the beginning of the month, more than 60% of companies have seen their share prices decline.
High-quality results this week from large companies such as Woolworths and Cleanaway were offset by weak results from Qantas and ongoing volatility in the software space.
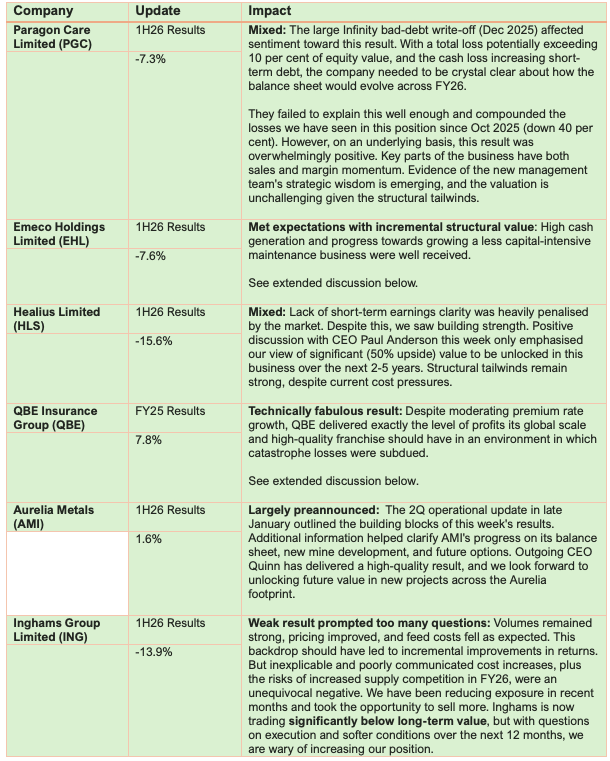
In this final week of results, Investment Matters presents our weekly results snapshot in table format. What company reported, the period for which the results are reflected, our view on the results, and the change in share price from the time of the result to the time of publishing.
The large number of companies reporting this week has meant the table is extensive and necessarily brief. In time, we will provide more detailed information, primarily on how the results changed, reinforced, or underminedour investment thesis. We will also include graphs and charts from the presentations that clearly capture the key trends that impact the long term.
This week’s in-depth discussions will focus on larger portfolio positions, including Emeco Holdings, QBE Insurance, Cleanaway Waste Management, and Helius. We will return to other important positions, including Woolworths, Worley and Nanosonics in the coming weeks.
The Market
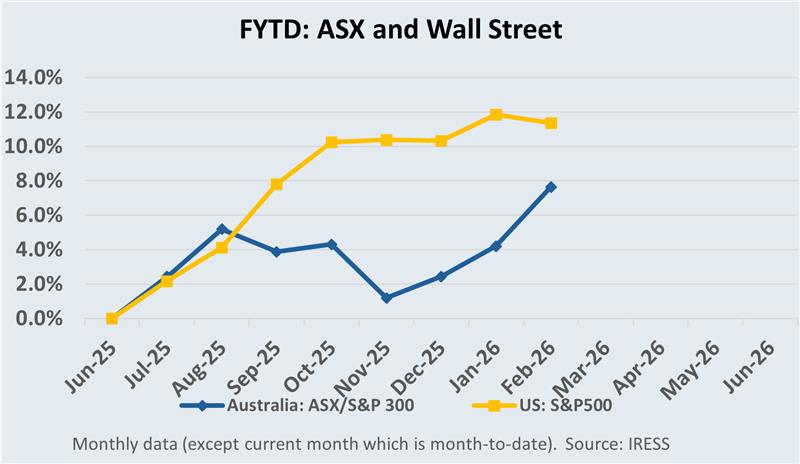
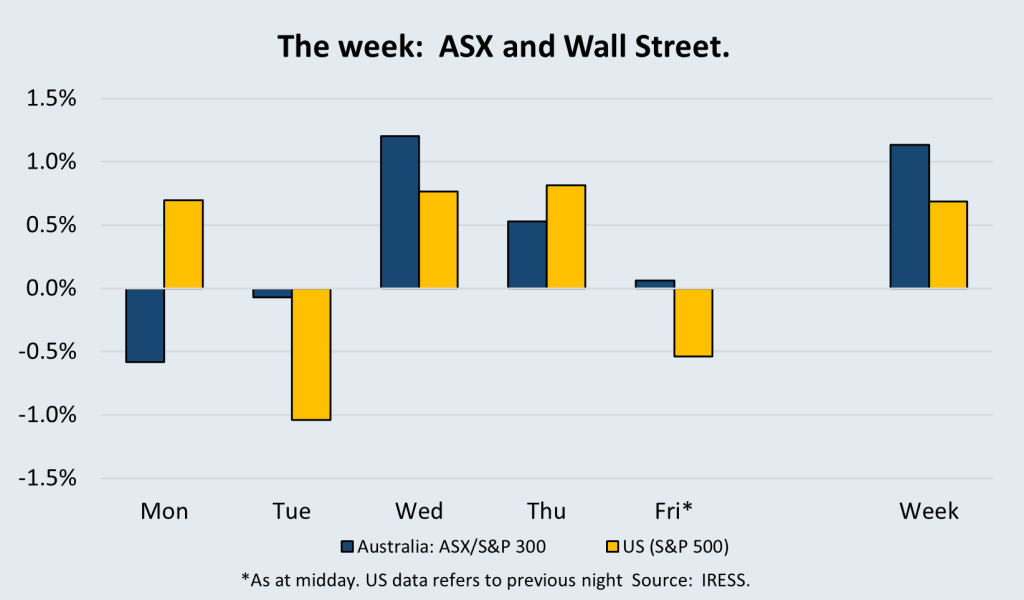
Table 1:
Week 3 Company reporting season – Portfolio results*** – Part 1
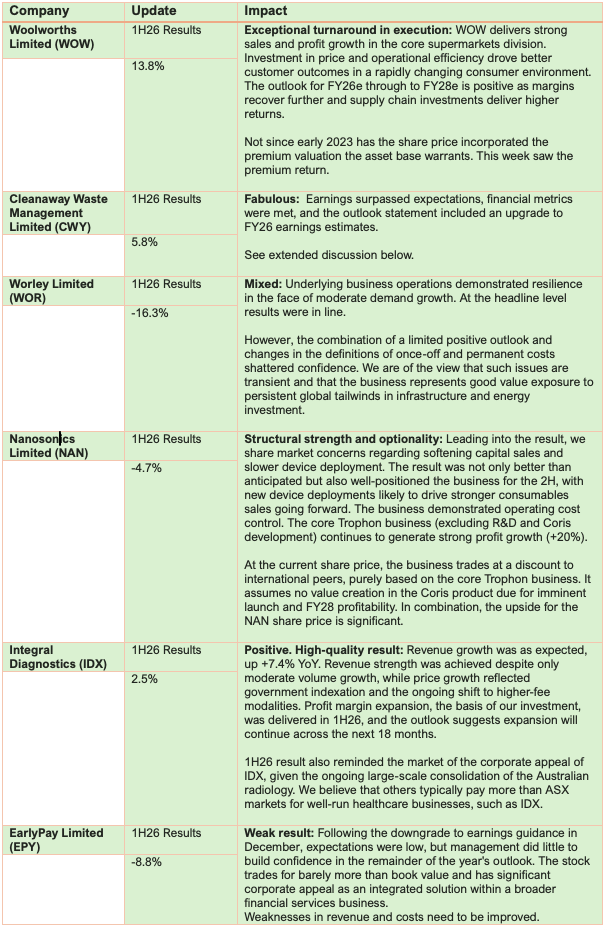
Table 2:
Week 3 Company reporting season – Portfolio results*** – Part 2
*** Price change is the percentage change in price from the day prior to the result to the market close on 27th February
Source: First Samuel
Emeco Holdings: Yellow trucks deliver cash
Emeco’s 1H26 result stood out for one simple reason: cash. Net cash generated by operating activities lifted 22% (+$26m) to $145m, reflecting stronger operating performance and continued discipline in working capital. On Emeco’s preferred measure, after maintenance capex, operating cash flow was $67m (up 37% on 1H25), highlighting that earnings are being translated into liquidity rather than trapped on the balance sheet as plant and equipment value.
Figure #1: Emeco’s great cash conversion leading to low leveraged balance sheet
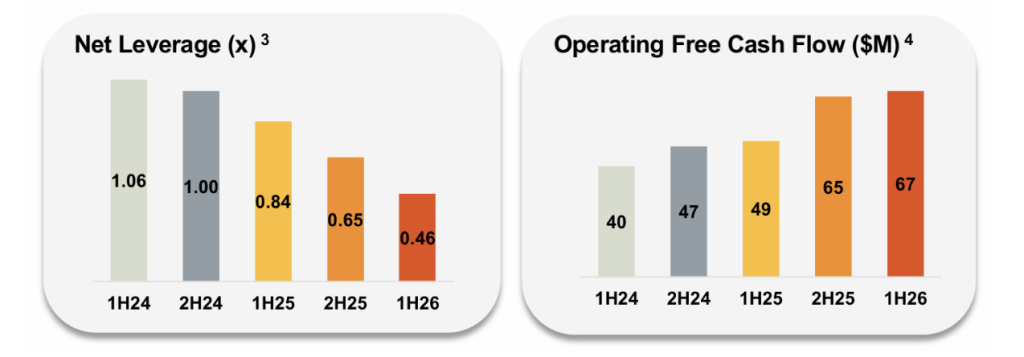
Source: EHL1HFY26 Result Presentation
Operationally, the more interesting signal was the mix shift toward maintenance and away from pure rental. Group revenue rose 9% to $420.8m, and Operating EBITDA increased to $155.5m, with the uplift largely driven by higher earnings from maintenance services. Higher maintenance intensity typically reflects customers prioritising “sweat-the-asset” uptime, which is positive for utilisation and earnings stability. It also tends to be stickier than purely growth capex-driven demand, smoothing the cycle.
If we were to believe the company’s hype, the increase in maintenance revenue also reflects technological and data-driven advantages. Emeco proving up these advantages over other providers of similar services is an area of possible future growth; proving to mining companies that their solutions are better than in-house provision of similar services has already been demonstrated and was the source of strong earnings in this half.
Figure #2: Increasing maintenance earnings highlights opportunity for profitable growth
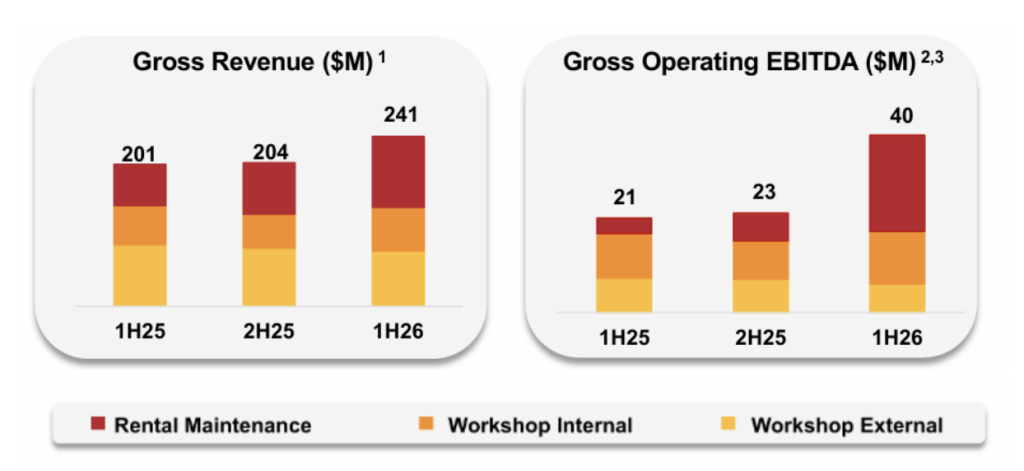
Source: EHL1HFY26 Result Presentation
In meetings with the CEO, Ian Testrow, and CFO, Tereas Mlikota, in our offices this week, the team stressed the business’s capacity to grow towards its Targeted 20% ROIC goals. By increasing less capital-intensiveearnings, the business’s cash earnings power will continue to grow without having to undertake another round of expensive “growth capital expenditure”.
The figure below shows the buildup in cash flow over the past 2 years, and the possible growth going forward if ROIC targets are met.
Figure #3: Operating Free Cash Flow $M (before growth capex)
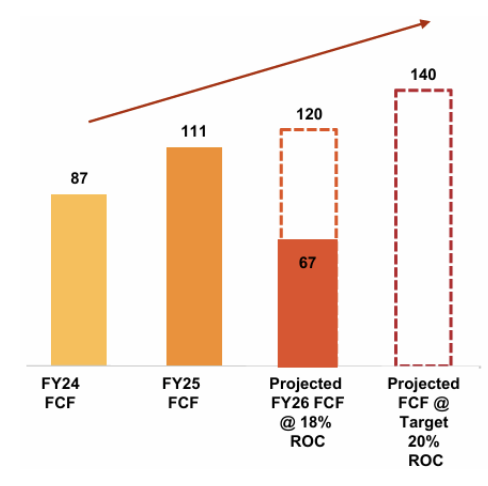
Source: EHL1HFY26 Result Presentation
The company finished the half with $171m in cash, $143m in net debt, and net leverage of 0.5x (at the bottom end of its new long-term target range of 0.5–1.0x). From a strategic lens, Emeco’s low leverage has mixed impacts. The balance sheet is simply not “stressed” in a way that invites a leveraged recap narrative. Emeco has, for some time, appeared a straightforward takeover candidate, if somewhat hamstrung by the 40 per cent stake held by Black Diamond, a firm that may not have an appetite to sell.
The 1H26 results clarified that the takeover defence was not merely conceptual, as Other Costs of $7.6m (including ERP implementation and takeover defence costs) were disclosed.
What disappointed the market in the short-term
It’s fair to say, though, that the result still felt light on explicit capital management in forward form. With sustaining capex of $87m simply matching the depreciation of existing equipment, and no growth capex in the half, some investors wanted clearer prioritisation of the excess cash (debt, buybacks/dividends, or M&A).
Instead, more nebulous concepts of strategic acquisitions, improving ROIC and balance sheet improvement were highlighted. In the next six months, we expect the uncertainty to be replaced by news of sensible acquisitions. Acquisitions of maintenance-related businesses are consistent with our view that to move value beyond NTA (net tangible assets), the emerging power of maintenance needs to both grow and prove resilient in different conditions.
Emeco has been in a profitable position in client portfolios for several years, and has risen by more than 60 per cent in FY26. We look forward to seeing how the business’s strength built over recent years can fuel growth from here.
QBE Insurance Group FY25 Results: Solid numbers prove up value
QBE Insurance Group released its FY25 results on 20th February.
The company reported a statutory net profit after tax of $2,157 million, up from $1,779 million in FY24. The company also announced a final dividend of 78 Australian cents per share and a A$450 million on-market share buyback. The results beat market expectations for FY25 and lay the groundwork for earnings growth in FY26.
Favourable catastrophic event risk and strong returns from US Crop insurance were the operational highlights. The result was rewarded by a share price increase of more than 10 per cent.

Insurance company earnings are exceedingly complex and can sometimes confuse or obscure simpler ways to explain the company’s progress. So, let’s try the simpler version.
The company exceeded all four high-level targets it set for itself at the beginning of the year. It collected higher premiums than expected, made more insurance profits on those premiums written, combined the insurance profits with investment returns to generate a return on its underlying equity capital that was higher than the target, and finally finished the year with a level of capital that was significantly higher than required or targeted by the company board.
So, QBE finished the year better capitalised, with higher run-rate income, and a more efficient balance sheet than it began the year. An excellent outcome.
Figure #4: QBE exceed all four of its benchmarks
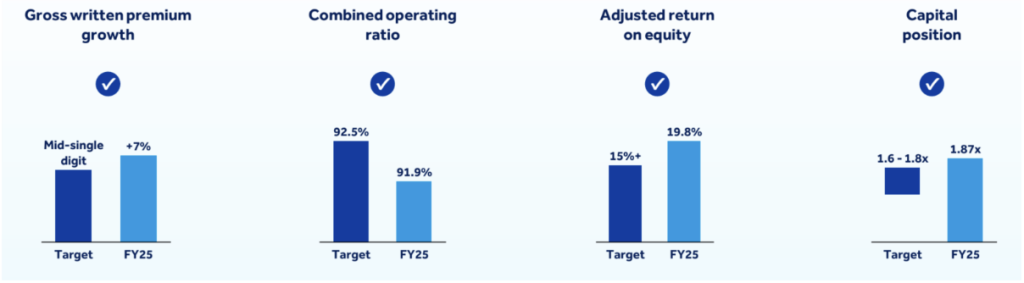
Source: QBE FY25 Results Presentation
Despite this, QBE remains amongst the cheapest stocks on the ASX in a market where globally relevant quality is increasingly overpriced. Markets generally discount insurance companies due to the potential variability of earnings; after all, the reason we have insurance is that bad things happen!
Figure #5: QBE @$22 is relatively cheap considering earnings per share and dividends
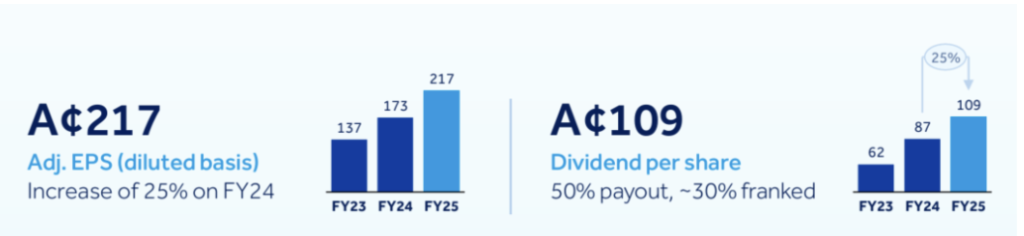
Source: QBE FY25 Results Presentation
Diversifying risks across industries, nations, and insurance types has been critical to smoothing insurance returns. Figure # below shows that, despite being considered a specialty insurer, QBE has built tremendous diversification across risk types, businesses, and geographies.
Figure #6: QBE diversification of insurance exposures
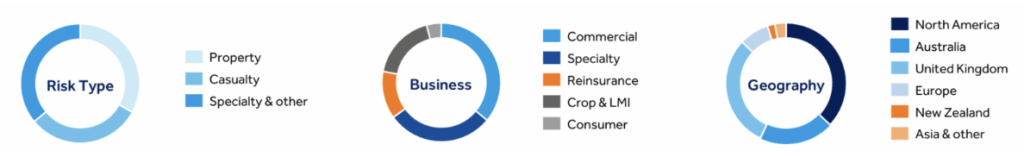
Source: QBE FY25 Results Presentation
But risks that remain include systemic problems with risk exposures that were poorly priced, as well as the impacts of catastrophic events (including floods and storms), which introduce tail risks of very high losses. These tail risk losses are increasingly limited by reinsurance policies retained by QBE and other global insurers. Reinsurance policies limit the total losses QBE incurs from each event, although QBE retains risks regarding the number of events in a given year.
The risk of losses each year, but the promise of strong returns otherwise, is too heavily discounted in QBE’s share price in our view. The record prices paid for Australian banks appear to assume that neither bad debts nor economic cycles are possible. Yet insurance companies, which face incidental risk, yield 30%+ higher dividends and a PE multiple 40% cheaper.
In addition, insurance company returns are positively correlated with higher interest rates. The chart below shows how QBE’s share price has responded to global interest rates (US 10yr bonds). We would argue there is further room to move higher.
Figure #7: Change in QBE stock price vs. US 10-year Treasury (indexed to 100 at Dec ’14)
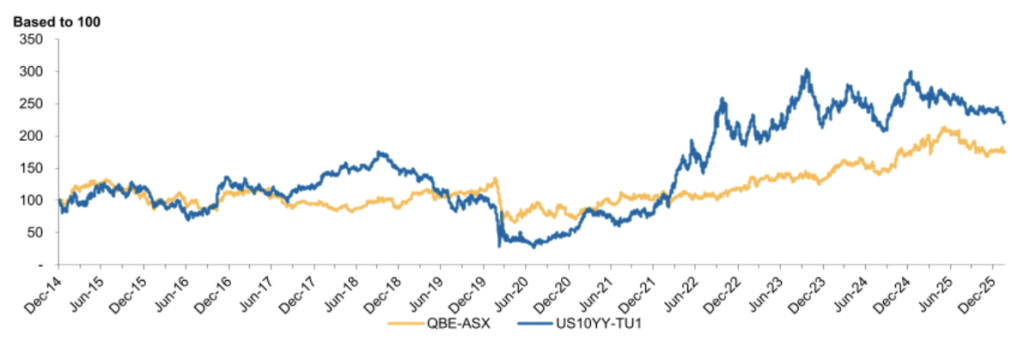
Source: Macquarie Research
Higher bond yields both increase the income earned on premiums paid upfront and reduce the balance sheet requirements for long-term risks such as life insurance and other long-dated risks. Banks, on the other hand, face higher risks of bad debt as interest rates rise. We would argue that recent moves that have rewarded both insurers and banks for rising interest rates are counterintuitive and exceptionally short-term-focused.
What were the negatives?
Looking ahead, QBE faces the risk of lower bond rates, weaker premium growth, and persistent claims inflation. Should a combination of these risks not materialise, profits can grow, but with premium rates turning negative in 4Q25, QBE’s ability to allocate capital effectively and manage the insurance cycle will come into focus.
QBE is guiding to a premium rate growth of 200bps below inflation. Historically, QBE has been able to pivot towards other businesses that can be written more profitably. Avoiding falling premiums is always key in insurance. Running an insurance company during a period when premiums are flat to falling is tremendously difficult. On the one hand, the cost of claims tends to rise with inflation, and the cost of running the business continues to grow.
On the flipside, in our view, there remains upside from budget over-conservatism and opportunities for reserve releases. Both reduce the risks to insurance margins caused by the mix of inflation and soft premium growth.
Overall
QBE has been a great portfolio performer generation a return of more than 13 per cent since June 2020, versus a 10 per cent return for the market overall. Whilst we may take profits at times, QBE is likely to remain a core holding in a balanced portfolio.
Healius Limited – 1H26 Result: Soft operations but structural value is clear
Since the sale of Lumus Imaging (radiology) on 1 May 2025, which delivered $822m in cash proceeds and a fully franked special dividend of 41.3c per share, the performance of the remaining pathology business has been mixed. The share price has been volatile, and the announcement of 1H26 earnings was not well received by the market, leading to a fall back to levels seen in August 2025. The more than 40 per cent rally off those levels is now fully reversed.
What has changed?
Improvements in operational efficiency, labour savings, and technology rollout have been offset by a recent Fair Work Australia decision that mandated a large wage increase for collection workers. Unfortunately, this increase has not yet been matched by the government’s commitment to raise the prices paid for Medicare-coded work. In time, we expect the government to provide the funding; however, in the short term, this has created uncertainty about earnings over the next 6 months. The ASX at this stage isn’t willing to pay for such uncertainties.
This has become a familiar reality for pathology and primary care-adjacent healthcare: labour is the profit line when rebate settings don’t move. In 1H26, group revenue rose 3.8% to $688.1m and underlying EBITDA increased 13.1% to $122.2m.
Encouragingly, pathology revenue growth was supported by a better mix—average fees were higher due to increased contribution from Genomics, clinical trials/B2B and veterinary channels. That’s strategically important because these segments can be structurally higher-margin and less tied to walk-in GP activity.
But the operational conversation remains dominated by wage pressure and how much of it can be absorbed through productivity.
Labour costs are still close to half the cost base, and the company was explicit about the effort required to claw back margin. Healius reported that labour as a percentage of revenue fell by 2.7 percentage points between Q1 and Q2 to 49.3%, driven by its labour efficiency program and workforce redesign. That’s meaningful progress, but it also highlights the underlying issue: when the “price” side of the equation is constrained by Medicare settings, management has to fight harder for every basis point of margin through staffing mix, roster discipline, footprint optimisation and automation.
The stress currently being experienced is magnified by the post-COVID-19 weakness in GP attendances that we have previously discussed. Total GP attendances were down 1.5% versus the prior corresponding period, with telehealth continuing to grow but not fully offsetting softer in-person volumes. Post-COVID utilisation patterns remain uneven, and subdued GP traffic matters because it flows through to downstream pathology episodes and reduces operating leverage.
But ultimately, this rebalancing of the system will pass, and future growth driven by population trends, wellness programs, obesity management, and a range of technological innovations in testing will re-establish an uptrend in pathology usage.
Beyond labour efficiency
At this stage, it is unsurprising and unavoidable that the market, and management to a lesser extent, is primarily concentrating on labour: more investment in productivity and system efficiency.
Management is already leaning on technology and workflow redesign—refining labour planning, rationalising collection/lab footprint, and expanding automation and AI-enabled processes—to create flexibility that rebate income simply doesn’t provide.
In our view, the long-term value that remains to be unlocked is rent and occupancy costs, where the legacy “clinic co-location” model is both expensive and inefficient when foot traffic is subdued.
Fixed leases and fit-out commitments don’t flex down easily, so even modest volume softness can compress site economics. This is why alternative delivery models matter and can progressively reduce reliance on expensive, doctor-adjacent real estate. In time, this will create a more resilient GP operating model, also one that isn’t subsidised by pathology rents.
The strategic prize is to break the tight linkage between GP visit volumes and pathology collections—shifting from “testing happens because a patient happened to be in the practice” toward a distributed network where collection is driven by referral routing, convenience, and direct-to-patient logistics.
We can see a range of partners.
Great value regardless of future developments
Our 1:1 meeting with the CEO this week only reinforced our view that the Healius team is striking the right balance between sweating the day-to-day operational efficiencies, developing new technologies, and managing government relations, all of which are key to medium-term earnings.
It is also clear that, over time, the capacity to develop new alternatives that reshape the pathology industry to deliver more effective customer solutions is central to their strategic thinking.
Ultimately, the value that can be unlocked from a top 3 market position in an industry such as pathology will be a multiple of Healius’ current value. Ensuring that existing shareholders, rather than a future acquirer, benefit is the challenge for the board and management team.
Cleanaway Waste Management: 1H26 Results
Cleanaway, the name synonymous with waste in Australia, delivered a great result in 1H26, building on progress made over the past 5 years. Heading into the results, there was conjecture regarding momentum in the business, and the stock had sold off from the $2.80 range since mid-2025.
The business, which operates a network of recycling facilities, landfills, and treatment plants in more than 350 locations across Australia, upgraded its guidance for the financial year after reporting underlying results ahead of consensus expectations for 1H26.
Underlying earnings before interest and tax increased by 16.9 per cent to $228.2 million, ahead of expectations of $220 million. This led the company to raise its full-year guidance to $480 million to $500 million.
The share price rose by more than 8 per cent.
Cleanaway is a large position in client portfolios, and we remain attracted to the quality of its assets and the opportunity for these assets to generate multi-year earnings growth. Strategic assets with genuine pricing power and structural tailwinds are rare, and we believe they should attract a significant premium, one not currently included in today’s share price.
The figure below clearly shows the multi-year build in EBIT margins, Return on Capital Employed (ROCE), and Return on Invested Capital (ROIC). The improvement need not stop at current levels, with return on capital measures arguably still needing to lift as productivity and systems efficiency continue to improve.
Figure #8: CWY – Multi-year build in EBIT margins and return on capital (both ROCE & ROIC)
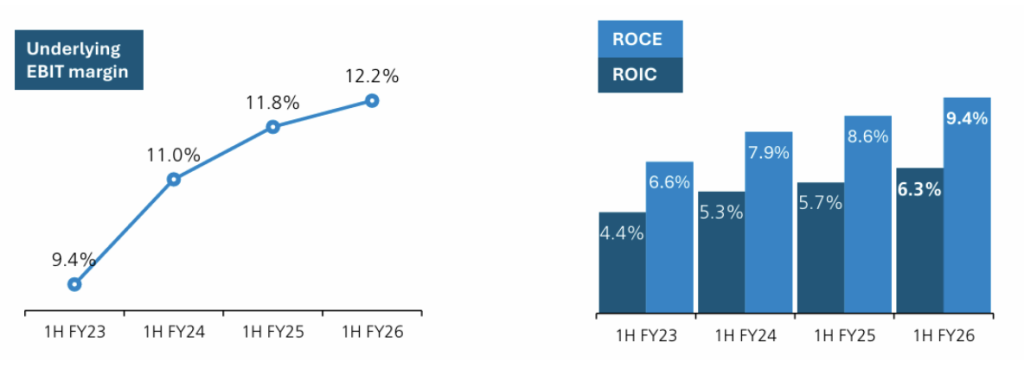
Source: 1H26 CWY Result Presentation
At the segment level, there was broad improvement across Solid Waste Services (75% of EBIT), Oil & Technical Services and Industrial Services. Only Medical Services saw declining earnings due to Cyclone Alfred’s impacts, in what is otherwise a robust business.
In the core Waste Services business, revenue grew by 7.5 per cent, EBIT earnings grew by 11 per cent, and corresponding margins expanded from 15.2 per cent to 15.7 per cent in the period. The ability for this business to grow with nominal GDP and deliver expanding margins is the basis for our investment thesis.
Listening to management discussions that accompanied the result, despite the positive outcomes, it isn’t easy to operate a diverse, highly regulated, long-term, capital-intensive business in Australia. However, when the company strikes the right balance between new investment, driving workforce productivity, growing through acquisitions, and managing government and regulatory frameworks, it can be a profitable venture.
In combination, it was pleasing to see how the development of profits from the management of each issue lead to an upgrade in FY26 guidance shown below.
Figure #9: CWY upgraded guidance
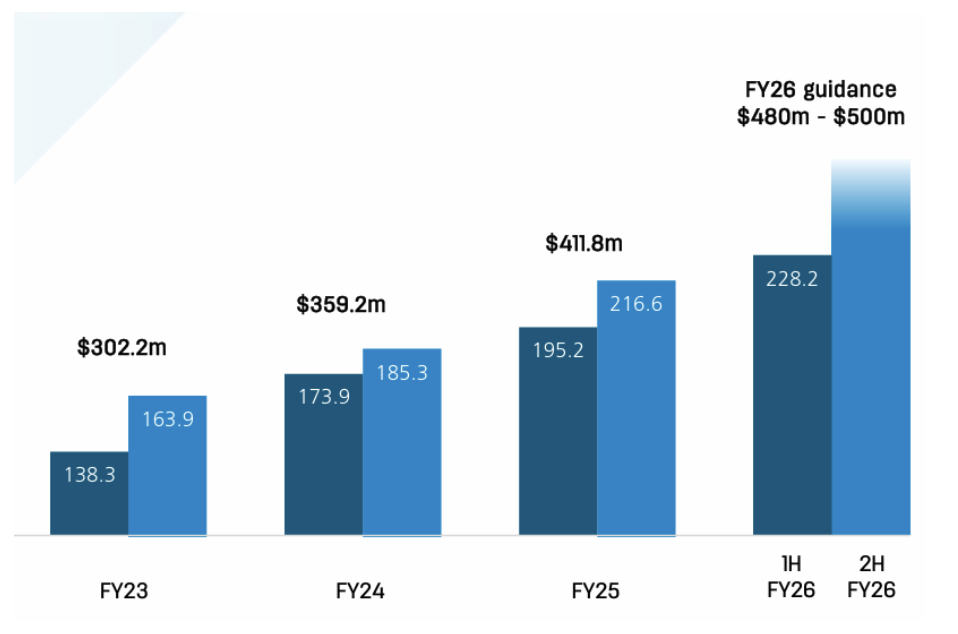
Source: 1H26 CWY Result Presentation
With additional leverage from rising population growth, infrastructure development, and ongoing efficiencies from new technologies, Cleanaway remains well placed.
The information in this article is of a general nature and does not take into consideration your personal objectives, financial situation or needs. Before acting on any of this information, you should consider whether it is appropriate for your personal circumstances and seek personal financial advice.