
Copyright 2025 First Samuel Limited
Key Takeaways
- Investment Matters provides updates during reporting season with a focus on portfolio companies’ results and market reactions.
- Stock market responses may not align with reported results, often due to differing investment timeframes.
- Emeco Holdings reports strong financial results with revenue growth and improved cash flow, reinforcing its market position.
- The company remains undervalued relative to its net tangible assets (NTA) and plans a debt restructuring for better future performance.
- Long-term objectives include leveraging technology and operational efficiency to enhance value beyond NTA.
During reporting season, Investment Matters will update clients on all the results for portfolio companies in a simple table that outlines the share price impact of the results, along with short notes on our views of the results.
Readers should expect to see instances where we believe the result was positive, yet the stock market reaction was the opposite, and vice versa. Such mismatches are often due to the difference in investment timeframes. We are assessing company results with a medium-term valuation perspective.
In Table 1 this week, we will provide a brief synopsis of the results and their impact for each company that reported. In the remainder of the document, we have four reviews of companies that reported last week: Emeco Holdings, Cleanaway Industries, Reliance Worldwide, and Challenger. Each is a significant or long-held position in client portfolios.
Additional in-depth reports, including those for the companies that reported this week, are planned for the four weeks following the reporting season in September.
Read the previous week’s Investment Matters.
The Market
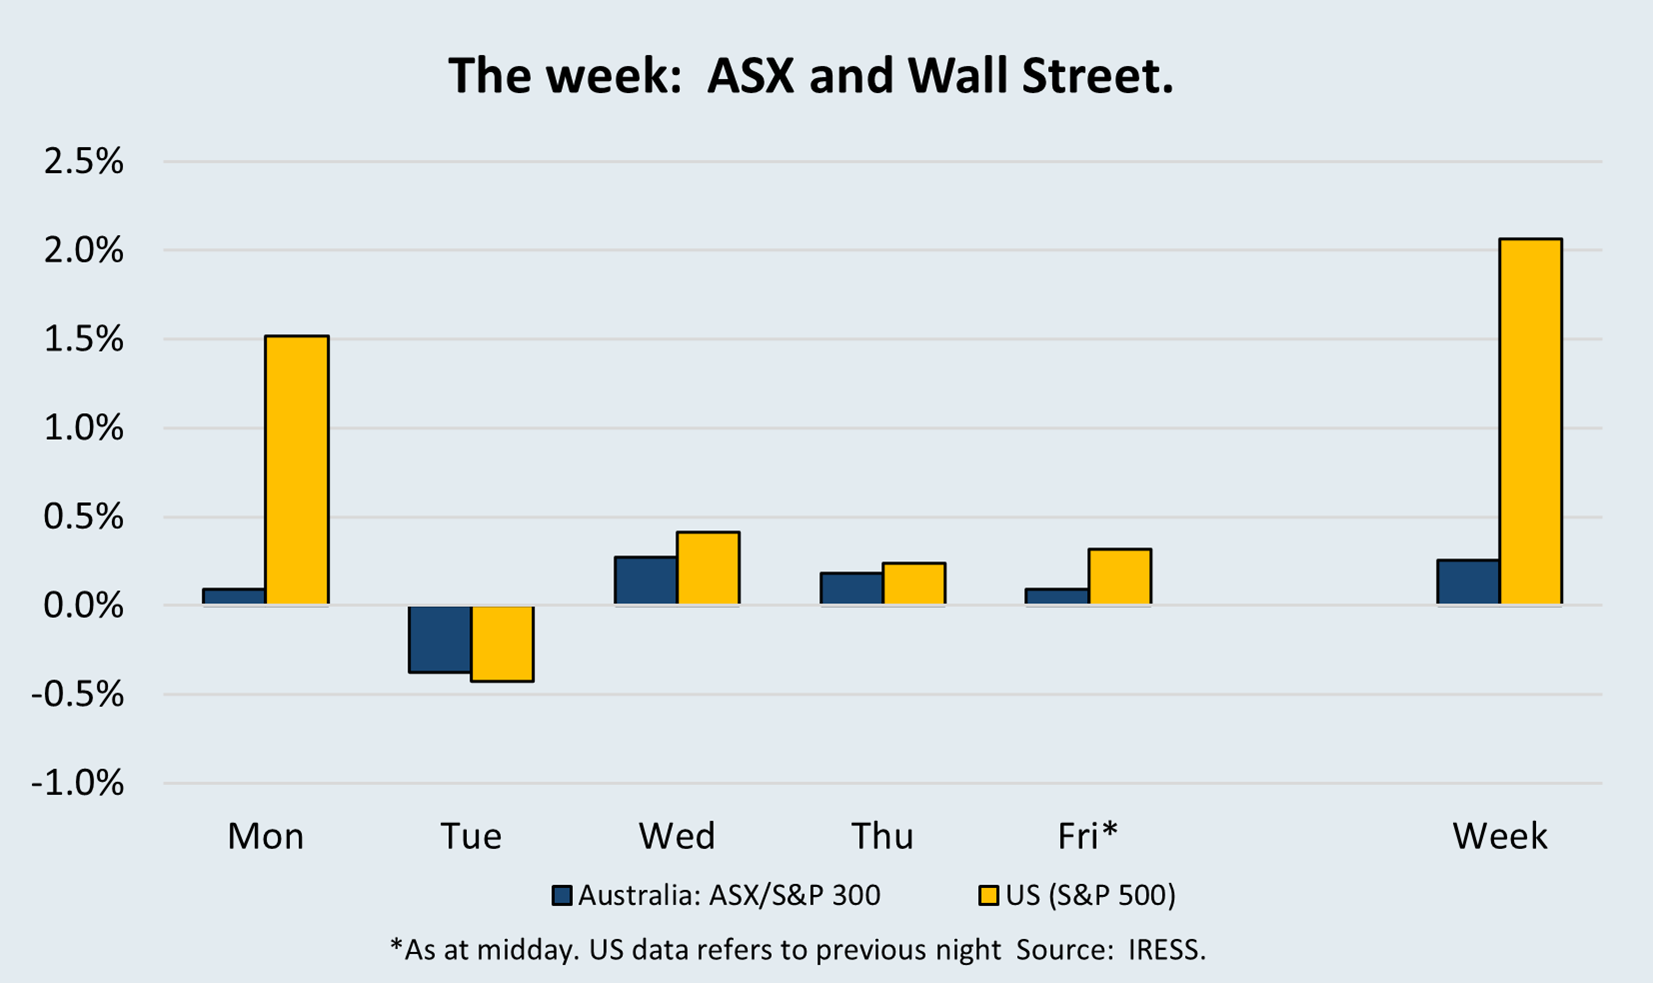
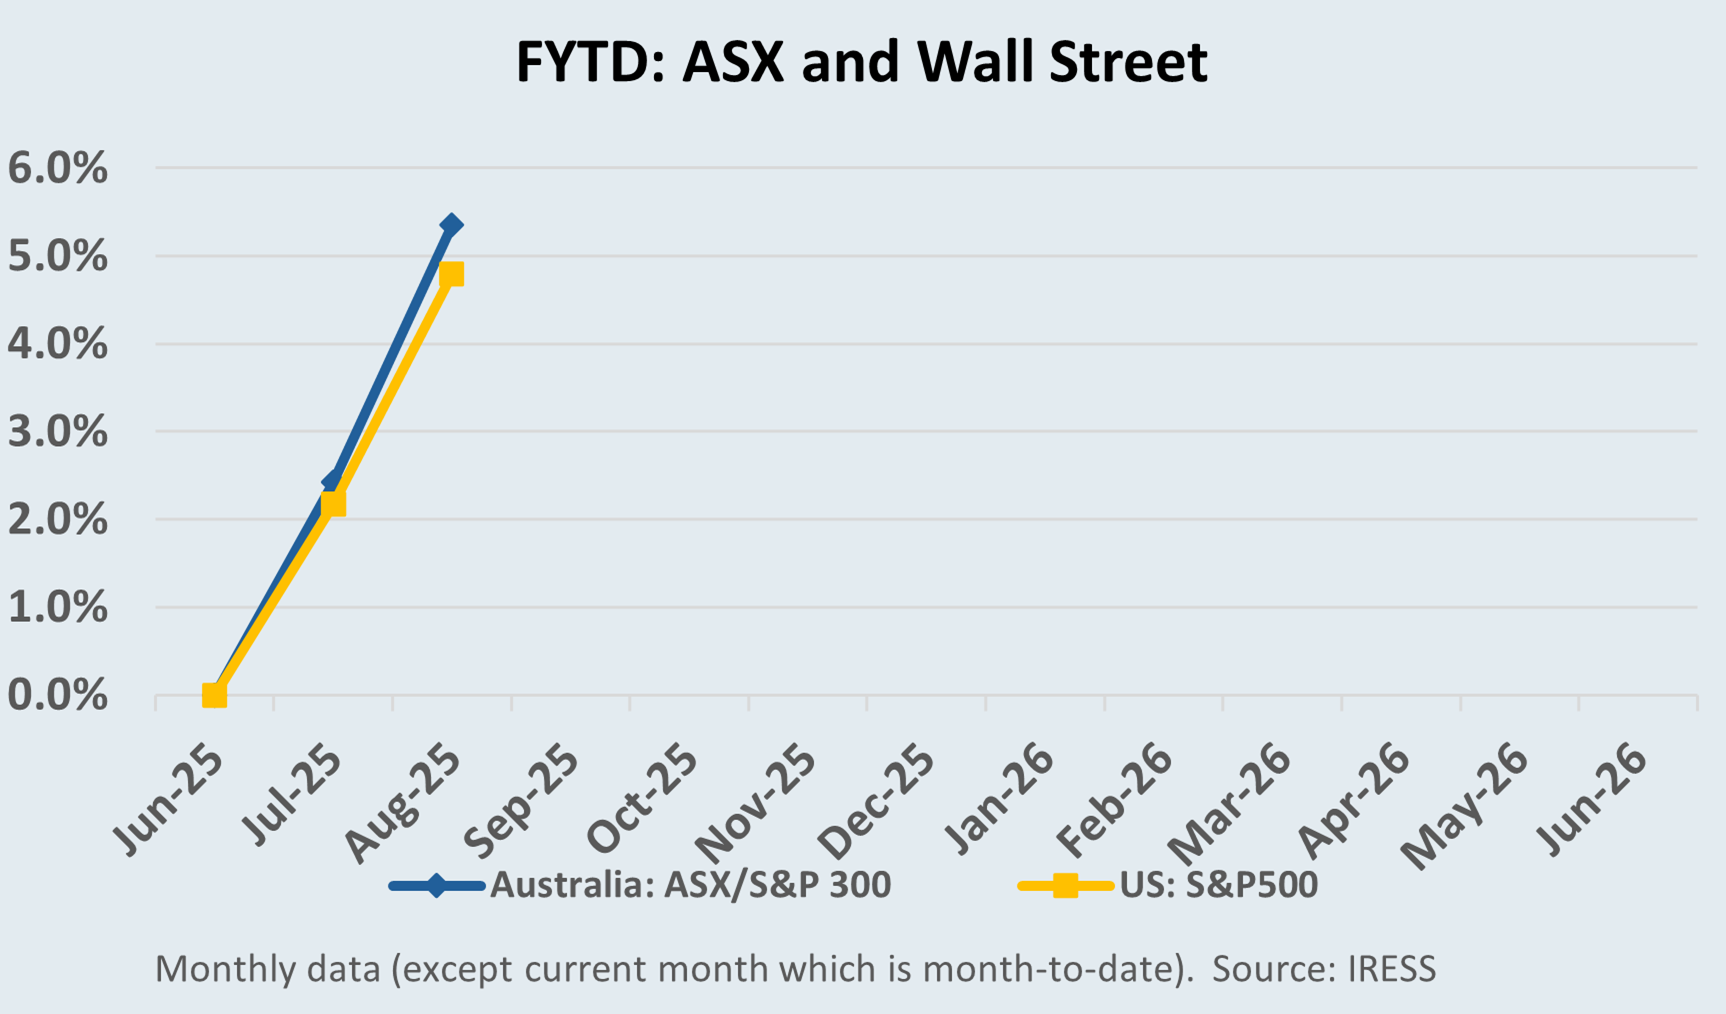
Table 1: This week’s reporting season result snapshot
| Company | Update | Impact |
| Nanosonics | FY25 Result | Positive: Heavy ongoing investment in the new Coris product obscures the underlying productivity and cash flow in the core Trophon business, 100% of current sales. Sales growth in both consumables and capital goods exceeded our muted expectations. The core Trophon business represents value amongst health-related stocks. Better head-office cost control is required in the long term. Valuation up 6-8%. |
| +9.7% | ||
| Imdex (IMD) | FY25 Result | Mixed: The market had high expectations leading into the result, and although the result was okay, there was some devil in the details. Higher capitalised R&D and cost inflation increased the earnings risk if drilling activity does not rebound in FY26. Clients sold their remaining position in August. More than 80% return since acquiring in mid-2023. |
| -11.3% | ||
| EarlyPay (EPY) | FY25 Result | Positive: High-quality result and good execution, but coupled with weak economic fundamentals and limited momentum in the business. Outlook for FY26 sees stock remain cheap in relative terms, with upside from capital management (buybacks or capital returns). We are confident the company is better suited to be a small part of a larger financial services business. |
| +5% | ||
| Nib Insurance (NHF) | FY25 Result | Positive: Underlying result slightly ahead of expectations and improving confidence in NHF’s outlook. We bought the stock last year when the market was overly cautious about federal government pricing decisions, cost control, and additional concerns regarding execution. We now only see limited valuation support in the NHF share price. We have appreciated the 34 per cent return since acquiring mid-year 2025 and now see a much smaller role in the portfolio for NHF. |
| -3.2% | ||
| Santos Limited (STO) | FY25 Result and takeover update | Positive: The most significant news for Santos was the extension granted to the Abu Dhabi consortium (now 19th Sept) to complete its bid for Santos. The probability of this takeover completing remains high, but far from certain. The operating result delivered this week increased our confidence in the assets we own, should the takeover not proceed. Upside if available for those with a longer-term investment horizon, willing to accept some execution risk. |
| +3.1% | ||
| Integral Diagnostics (IDX) | FY25 Result | Positive: IDX was oversold in late 2024 due to a series of industry changes and execution problems that reduced market confidence. This underestimated the capacity for improvement, the tailwinds in the industry and the quality of the assets. This result highlighted improvements in margins, cash flow, acquisition synergies, and expense control. Although it occupies only a small position and is not in all client portfolios, the upside remains, and we expect the position to grow. |
| +8.1% | ||
| Inghams (ING) | FY25 Results | Weak: We appreciate the long-term growth, high-quality assets, and market position of Inghams. We also recognise that there will be short-term fluctuations in pricing, feed costs, timing of customer contracts and capital spending programs. These fluctuations provide an opportunity to trade the stock in line with our long-term valuation. A weak wholesale chicken price impacted Inghams’ earnings in late FY25 and risks any growth in FY26. This hit is likely short-term in nature, and we anticipate increasing our holding again in the medium term. |
| -23.7% | ||
| Paragon Care (PGC) | FY25 Result | Mixed: After almost a year of integration of the former PGC business with CH2, the company is hitting its stride. The new business is materially different from Paragon’s pre-merger operations; critically, the expertise in execution at PGC remains exemplary today. FY26 will provide First Samuel with a clear picture of how this new business can generate strong cash flows. Building conviction around cash is required for PGC to remain consistent with our long-term investment preferences. |
| -15.0% | ||
| Worley (WOR) | FY25 Result | Positive: High-quality results with an emphasis on long-term margin expansion. This exceeded the market’s muted expectations. As we have previously noted, Worley is exceptionally well-positioned to utilise AI to deliver better customer results and drive higher margins. Early evidence was apparent in this result. With ongoing investment in sustainability globally, we like our position in Worley as a global leader in infrastructure and construction delivery. The company’s emphasis on expanding margins could drive considerable upside in share price from current levels. |
| +16.1% | ||
| Healius (HLS) | FY25 Result | Positive: Healius (HLS) is the second largest private pathology provider in Australia. The market remains sceptical that the company can control costs, but this result provides initial supporting evidence and medium-term goals that are achievable in our view. Following the large special dividend payment in FY25, the share price has been weak, and represents a high-quality future source of profits in the portfolio. Once again, we retain an eye for the quality of the assets rather than the short-term earnings volatility. |
| +12.3% | ||
| Aurelia Metals (AMI) | FY25 Result | No change: Following the disappointing Investor Day in June, the financial results provided limited information, highlighting only the quality of the balance sheet and the sequential improvement in the business. Our current position reflects a balance of risks, including a delayed free cash flow outlook, concerns about the Federation ore body, and threats to the timeline for achieving regional asset optimisation. More positively, Aurelia still represents a value-oriented base-metal exposure with a strong balance sheet and M&A optionality. These features alone warrant a higher than current share price. |
| +13.8% | ||
| Ora Banda Mining (OBM) | FY25 Result | Positive: A relatively new portfolio position that replaced our successful positions in De Grey and Catalyst. OBM remains an organic growth story with significant exploration potential, which is now being unlocked by a substantial exploration budget. Its financial results were excellent, underpinned by a well-executed underground mine strategy with Riverina providing solid free cash flows to self-fund the second Sand King mine, which is now delivering at steady-state production levels. |
| +17.8% | ||
| Woolworths Limited (WOW) | FY25 Result | Negative: Conservative clients retain a small position in Woolworths as a multi-year hold. Remaining clients sold out entirely in the past twelve months. The FY25 result reinforces our view that Woolworths is not currently executing its store and pricing strategy effectively. A deterioration in some of the basics, including inventory management, was sobering. These are medium-term concerns; the long-term value of the franchise remains. We expect to rebuild this position at lower price levels in the coming years. |
| -15.2% |
The price change % is the movement from the time of results release to EOD on Thursday, 28/08.
Emeco Holdings (EHL): Delivering toward NTA (Net Tangible Assets) and beyond?
The 8% plus increase in share price on relatively high volume demonstrated the market’s appreciation for the company’s results delivered on 17 August.
Key Financial Results
- Underlying revenue rose ~7% to $785m
- Operating EBITDA climbed 7% to $301m, with margins expanding to 38% in FY25 and even higher in the second half.
- Operating EBIT, after implied capital costs, increased 16% to $146m, demonstrating great leverage to positive conditions.
- Vitally operating free cash flow was strong at $11 4m, up 32%
Readers will recall that Emeco has been a long-held and profitable position in clients’ Australian equities sub-portfolios, delivering capital goods on a hire basis to the mining industry. In the vernacular, Emeco owns and rents out yellow trucks.
This week, we spoke with CEO Ian Testrow and CFO Theresa Mlikota at our offices, discussing the excellent results and the business outlook over the next 3-5 years. We came away from the results, along with discussions with the company and analysts, with the understanding that the stock price remains inexpensive while it trades as a discount to NTA.
Towards NTA (Net Tangible Assets)
To build a successful capital goods hire business, in our view you need to be good at four operational aspects:
- The business must buy the right assets for the right price
- It must maintain the assets well; when damaged or worn out, it must repair them efficiently
- It must write a contract with clients with prices that generate revenue and profits that correctly incorporate the long-term costs of maintaining and replacing its capital equipment
- It must collect the revenue that it has earned.
In addition, from the perspective of the equity owner, the business must accurately maintain its accounts and clearly communicate to the market the value of its assets in a timely and accurate manner.
When each of the features and reporting lines is in place, and when demand is strong, there are few reasons that a company should trade with an equity share price that is lower than the net (after debt) value of its tangible assets. Circumstances in which a discount to NTA remains appropriate could include:
- Weakening demand
- High levels of debt
- Concerns about the sustainability of the value of the assets
- Limited free cash flow – raising concerns about the convertibility of the asset value into operating cash.
In recent years, there have been instances in the Emeco business where elements could have driven a discount at various times.
There are no such factors today. There are no limits to the stock trading at or above its NTA, of at least $1.30 per share, if not higher.
Emeco has sometimes struggled to generate strong cash flows, but the past five half-years have shown significant improvement (see Figure 1, below). Not only have operating margins improved, but they have also coincided with strong cash generation.
Figure 1: Medium-term financials, free cash flow (LHS, $m) and margins (RHS).
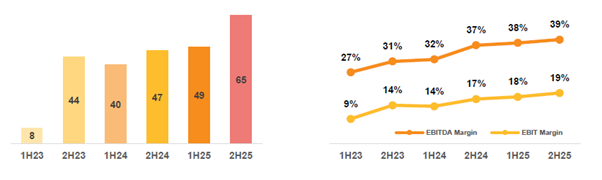
Source: EHL FY25 Results Presentation
As cash generation has improved, there has been a commensurate reduction in debt levels, to the point at which the company is likely under-geared. Low levels of debt in a capital-heavy business are arguably suboptimal, but in this case, it makes perfect sense. Emeco is due to restructure its entire balance sheet in the next 12 months. Starting with an exceptionally strong balance sheet is advisable when approaching lenders to discuss future gearing and the cost of debt.
We look forward to the results of this debt reorganisation over the next 6-12 months.
Beyond NTA (Net Tangible Assets)
Ultimately, a business such as Emeco should trade at levels above NTA, as it adds value beyond simply owning the assets. Value includes its ability to repair equipment, a service it provides to internal and external customers at its Force Workshops. Another value lies in the capacity to generate excess returns. By providing staffed equipment to mining companies, it reduces not only capital but also labour requirements of mines, which can sometimes struggle with cash flow, especially in early production or subscale phases of production.
In the medium term, Emeco may generate additional value through its advanced technology strategy, including the rollout of the Emeco Operating System (telemetry and analytics) and the progression of its Microsoft Dynamics 365 ERP implementation, slated for FY26 deployment.
The first step to achieving a share price beyond NTA will be to replicate the operational performance of FY25 in FY26. Given reasonable conditions, including fleet utilisation, maintaining existing projects, and adhering to cost discipline, a strong cash flow outcome should be achievable.
Cleanaway (CWY): Stewardship and quality?
Cleanaway Industries delivered its FY25 results on 20 August. After the share price rose by almost 6% in July, leading up to the result, Cleanaway’s stock price has given back most of the rise since the result.
Cleanaway delivered FY25 underlying EBIT ($412m) primarily in line with Consensus estimates and at the mid-point of its $395m to $425m guidance range. Despite all this, the outlook for FY26 disappointed on several fronts, including EBIT and net finance costs. There was a limited change in our long-run valuation (down 1%).

Operationally, Cleanaway often appears more challenging than its asset quality would otherwise suggest. We appreciated the continued improvement in Return on Assets (ROA) and remain attracted to the strategic value of its portfolio.
However, the quality of the result was not exceptional, and the fact that the stock sold off in the past week may be related to this quality. Without getting into the weeds that excite equity analysts such as the author, not all numbers in a set of accounts are of equal quality or robustness. Often, companies will use a less robust solution to accounting interpretations to inflate the appearance of earnings and their sustainability going forward.
Very little (other than fraud) can change the cash a company produces, but an enormous range of accounting estimates present in a company’s accounts are non-cash.
To assist with interpretation, companies will present normalised or underlying profits to remove factors that are unlikely to be repeated in the following year. More aggressive interpretations avoid removing once-off earnings that would lower underlying profits, and remove costs from underlying profits, making profits rise when these costs are likely to continue.
In this result, for instance, Cleanaway included a one-off benefit of $7.5m from a “net gain on sale and leaseback” and beneficial movements in “other” provisions totalling $10.2m in FY25 compared to FY24. The impact of this aggressive accounting next year could be to make achieving Cleanaway’s guidance more difficult, unless they find a new adjustment to keep up with last year’s. Such accounting gymnastics are called “low-quality”.
Operations and assets
At the operational level, we remain impressed by the way the team manages its operations and assets. For instance, in Solid Waste Services (80% of earnings), we saw the following trends.
- Overall, 6.0% net revenue growth driven by pricing discipline and volume growth, with exceptional leverage delivering 12.8% EBIT growth
- The Commercial & Industrial sector has substantial collection and steady earnings
- Municipal collections grew through new services and improved labour efficiency
- Landfills and Transfer Stations’ earnings were lumpy
- Resource Recovery returns improved with higher commodity volumes and prices
This sector helped drive an overall improvement for the third consecutive year, as shown in the Figure below. The consistent improvement in ROIC is the most precise representation of Cleanaway’s future returns’ capacity to continue growing. With a large embedded capital base and the proposition that the cost of waste collection will increase at a rate equal to or faster than inflation, we should expect continual improvement in this metric.
Figure 2: Ongoing strength in earnings highlights medium-term value. EBIT (LHS), and Return on Invested Capital (ROIC) (RHS)
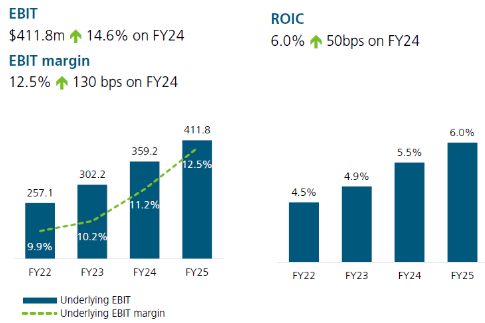
Source: FY25 CWY Results Presentation
The excellent stewardship of the current asset base reinforces our long-term view of the intrinsic value of Cleanaway’s landfill assets and customer contracts. We also remain impressed by the progress it is making against its Blueprint 2030 aspirations.
Figure 3: Blueprint 2030 – a plan which leverages Cleanaway’s unique asset position
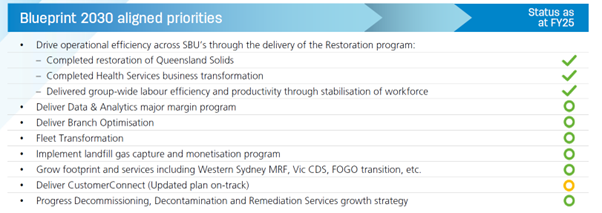

Source: FY25 CWY Results Presentation
As clients and regular readers would be aware, we always maintain one eye on the underlying value and another on the price we pay for a company’s stock. Figure 4 below shows the relative price paid for CWY as compared to the entire market.
In this case, Cleanaway continues to trade at a premium to the market, but below the average premium the stock has traditionally traded. This is not a huge surprise considering our view that parts of the market are costly, but it remains indicative of the relative value we retain in the prominent position in client portfolios.
Figure 4: Cleanaway relative value – cheap against its own history
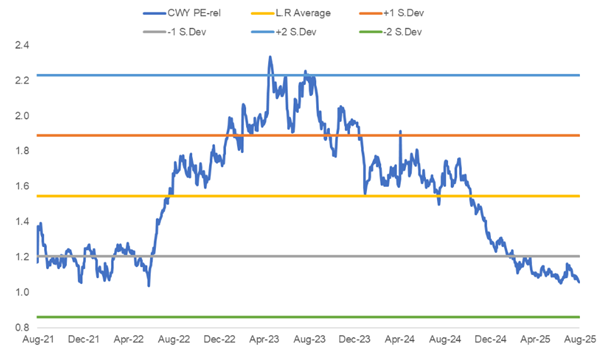
Source: Jarden Research, FactSet
Reliance Worldwide (RWC): Hit by tariffs and US housing trends
One of the strongest trends in the ASX this reporting season was the impact of the slowing US housing market. The ASX is home to three Australian companies with significant exposure to the US housing market, either as providers of products for new housing construction, the R&R (repair and remodel) market, or through the provision of irregular purchases such as hot water services or general plumbing products.
The table below shows the impact of a slowing market on three large listed Australian companies. Clients may have noticed that the fall in James Hardie’s share price was large enough to prompt First Samuel to add the position to the portfolio for a range of clients.
| Company | Price Change since June 30th 2025 | Price Change since June 30th 2024 |
| Reliance Worldwide (RWC) | -4% | -4% |
| Jame Hardies (JHX) | -15% | -35% |
| Reece Limited (REH) | -29% | -56% |
In each case, the formerly Australian-only company has extended its exceptional Australian performance into US assets and markets. Some retain some domestic manufacturing, partially servicing the US market, whilst James Hardie’s is now predominantly a US business.
The size of the US market is, of course, a fabulous prize, and for each company, the US now represents a considerable share of total value. The downside is that when conditions soften, the impact on earnings and in turn, the share price can also be large. This was the backdrop to Reliance Worldwide’s result on August 19th.
The result
We saw the FY25 numbers as illustrating a high level of resilience in the face of mixed global demand conditions and headwinds from tariffs and copper price volatility.
Net sales were US $1,314.7m, a 5.5% increase on FY24. Most of the growth stemmed from the integration of the Holman Industries acquisition. A softer demand was observed across several key geographies.
In the Americas, sales softened due to weaker residential new-build activity and subdued discretionary renovations, consistent with broader housing market challenges in the US. Management pointed to stable demand in the R&R channels, particularly for the SharkBite push-to-connect range. Critically for our long-term valuation, this segment demonstrates margin resilience indicative of a strong brand and strategic distribution.
In Europe, the Middle East and Africa (EMEA), RWC navigated macroeconomic softness in continental Europe and resilient sales in the UK. We saw evidence of progress in areas of innovation and premiumisation.
Critical to our process, and again, indicative of the strategic value of the Reliance assets, we saw a great cash flow of US$271 m, generating a conversion rate of 98% to EBITDA. Consequently, financial leverage has fallen, and the strengthened balance sheet means RWC is well-positioned for future acquisitions or to ride out any short-term macroeconomic weakness.
In terms of managing our position in a company that has been a long-term portfolio holding, we note that RWC’s management style tends to accentuate short-term concerns, which provides the market with additional uncertainty. Overreacting should be avoided; however, by the same token, avoiding additional purchases without new clarity on the US should be avoided.
In the result itself, however, we saw few long-term difficulties and no negative impact on our long-term valuation. We remain attracted to high-quality assets, demonstrable value creation through acquisitions, and market-leading brand names. As US conditions improve and tariff pricing is resolved, we see significant upside from current levels.
The company isn’t standing still regarding the external risks the business faces in its supply chains. We were particularly impressed by one slide in the FY25 presentation. We have replicated this in the figure below. The figure illustrates how rapidly the company has relocated its supply chain away from China to mitigate the impact of tariffs and geopolitical risks.
We view this behaviour as consistent with a business that has a long track record of supply chain optimisation and a product range that has the underlying profitability to allow for reinvestment in change, even in periods when top-line revenue is under pressure.
Figure 5: Moving away from China
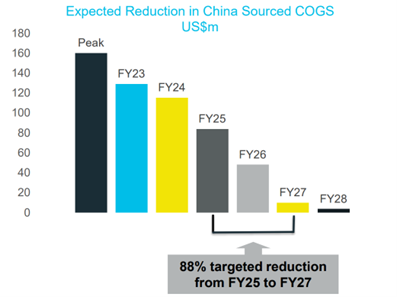
Source: FY25 RWC Results Presentation
Challenger (CGF): Tailwinds continue – along with the share price
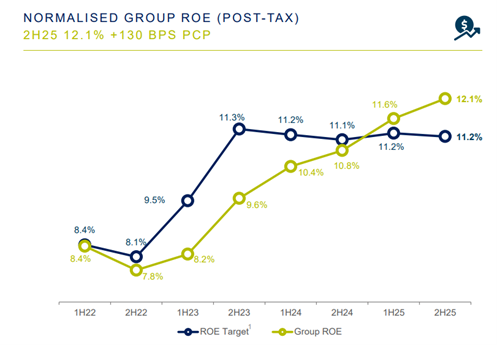
Positive: Challenger met expectations with Return on Equity above its target for the second consecutive half. The combination of interest from strategic investors, focus on the positive impact of the APRA capital changes, and improving sales dynamics is all supportive of the current share price. The combination of earnings certainty and balance sheet flexibility resulted in a 3-5% rise in our valuation.
Figure 6: Above target Return on Equity is the highlight of Challenger FY25 result.
Source: FY25 CWY Results Presentation
We are mindful not to oversimplify the Challenger business in this review, as several of the drivers of the 36% return we have earned on this significant portfolio position since September 2024 are either highly technical or relate to value likely to be captured through innovation in response to regulatory change.
At its core, Challenger Limited is an Australian investment management and retirement income specialist, with two core pillars. One is its Life Division, which operates Challenger Life, the nation’s largest provider of annuities. It offers lifetime, fixed‑term, and indexed annuity products designed to convert superannuation savings into secure, guaranteed income, especially in retirement.
The other division is the Funds Management Division, which operates through brands such as Fidante and Challenger Investment Management, serving both retail and institutional clients.
Much of the value unlocked over the past year relates to improvements in the value of the Life Division. The value unlocked has at least two drivers, one is the increased confidence that Challenger could leverage its sales capacity to drive additional growth in Annuities sales, against an improved backdrop of higher interest rates. The other relates to the changes in regulation which, whilst long foreshadowed, were too heavily discounted in the share price last year when we acquired the position.
The improved regulatory and sales backdrop was also combined with evidence of a lower operating cost base, the earnings leverage the market was willing to pay for materially increased. This in turn led to a strategic investment by TAL, a subsidiary of Dai-Ichi Life Holdings Inc, in the business, acquired for a premium to the prevailing share price. This event alone refocused the market on the underlying value of the Challenger franchise.
So what are the regulatory changes?
At its core, the company needs to hold less capital against the assets and products it provides and has increased flexibility in the way it manages its risks. Under the APRA Prudential Standard LPS112, the new proposal allows a higher discount rate and thus lower capital requirement if insurers demonstrate a close matching of assets and liabilities. Challenger has stated that the changes will provide greater product innovation, more competitive pricing and, in turn, increased availability of product for retirees.
We agree with each of the claims, but also acknowledge that the most significant financial impact is the likelihood of capital returns, an even stronger go-forward ROE profile (as shown in the previous figure), as well as reduced pro-cyclicality during market downturns.
In company valuation theory, being less pro-cyclical and more flexible with capital has a significant impact on the price an investor is willing to pay for a company’s earnings.
Over the next two years, Challenger can prove the theory correct and unlock the capacity we and other analysts believe is available.
For the portfolio, however, it is essential to note that a significant portion of the expected value is already reflected in today’s share price, and therefore, the position may decrease in size if the expected premium further reduces as the share price continues to rise.
Simple story: We appreciate the long-term tailwinds Challenger faces, we appreciate the improvement in its capital position and are conscious that the strategic investor may look to acquire the business in its entirety. However, there is a limit to what Challenger is worth, and recent appreciation makes us closer to that point.
The information in this article is of a general nature and does not take into consideration your personal objectives, financial situation or needs. Before acting on any of this information, you should consider whether it is appropriate for your personal circumstances and seek personal financial advice.