
Read the previous week’s Investment matters.
Photo © sasirin-pamais-images from Via Canva.com
Amid the noise, there is much to like
Both the Prime Minister and Leader of the Opposition noted this week that so much is happening in the world that requires little additional commentary. We concur regarding global investment and would add that it requires much patience.
However, when we look at the details underpinning the global investment outlook, we see a range of particularly encouraging trends. In this week’s Investment Matters we have included a brief review of our International Equities positioning.
In addition, we provide comments on the Beach Energy result, one of the first portfolio positions to report updated earnings. Next week, the regular company profit reporting window or “earnings season” ramps up, and we look forward to providing updates on portfolio positions weekly into the middle of March.
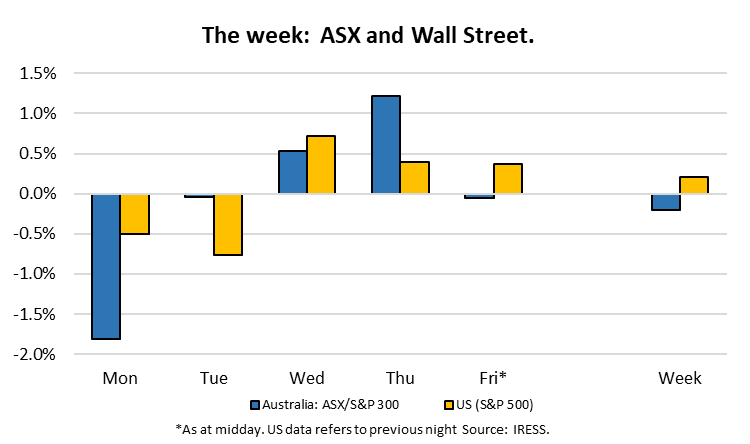
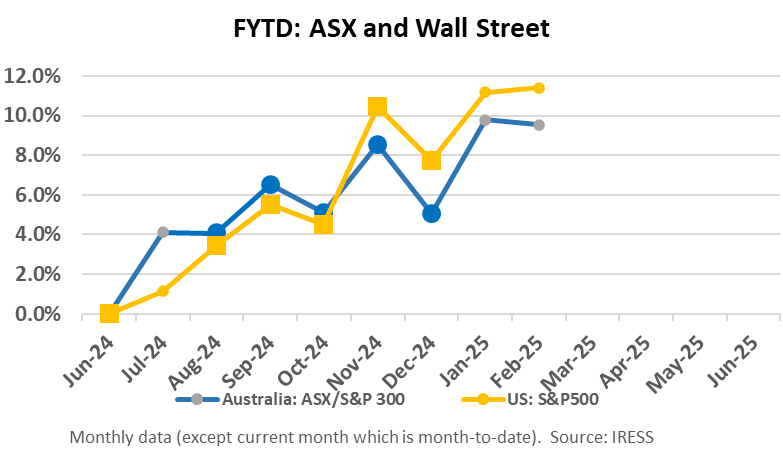
The Market
Global Equities: Our view
Clients would value First Samuel’s investment in International Equities, which consists of a range of investments in highly liquid ASX-listed ETF positions. Our positioning reflects our views on the relative value of different global markets and the outlook for the Australian dollar when its value against the USD is extremely dispersed from long-term averages.
We view the diversification value of International Equities as vital for Australian investors. International holdings in general, provide three critical features to a portfolio:
- International holdings provide access to companies otherwise not represented in the Australian equity market. Global companies such as Visa, Google and Microsoft affect our everyday lives. Some are central to the way the Australian economy is likely to evolve. Investing in their success makes sense. However, there can be very little reason to search for comparable global equities for many other companies, such as supermarkets or copper miners, when the Australian companies already listed here provide adequate exposure.
- Owning International Equities reduces possibly excess concentration in narrowly focussed large Australian companies, especially banks and miners. This is less of an issue for First Samuel investors due to our active management but relevant for others who closely match the ASX300 index, including Industry Superannuation funds.
- The economic outcomes for Australia and the rest of the globe can vary considerably. Creating a portfolio that benefits from higher relative growth from the Rest of the World at times when Australia is underperforming and vice versa, makes sense. Returns are not compromised but volatility is reduced.
Don’t waste the benefits
Given the benefits, we must ensure we don’t waste the diversification benefits of international equities by choosing investments that limit these benefits. Moving concentration from Australia to the US for instance, should be avoided, nor do we want to replace concentration in BHP or CBA with concentration in Nvidia or Microsoft. Similarly, suppose we seek exposure to global economies at different economic cycles. In that case, we shouldn’t simply invest in the United States, nor only in economies driven by the same global trends.
These issues are particularly relevant today with increasing risks from a Trump presidency at the same time as the US share market is expensive, the concentration of stocks within the US is extreme, and the relative importance of the US markets within all global stock markets is historically elevated.
Short term trends
In recent weeks, we have seen some fragility in the most prominent names such as Nvidia and Amazon, and as mentioned in last week’s Investment Matters, we are conscious of not simply accepting that short-term trends last forever.
In the following charts, we highlight these trends and follow them by explaining how we counteract the risks.
When investing in a global index, the share of the amount invested that finds its way into each global market is usually defined by market capitalisation and a range of administrative rules that cover liquidity. In general, if one market rises faster than others, its share of the global index increases over time. The following chart shows the USA’s share of two core global MSCI indexes. MSCI is the dominant provider of index creation services globally, and its benchmarks are widely considered the standard.
Figure 1: MSCI USA weight in major global benchmarks

Source: LSEG DataStream, MSCI and Schroders.
The implications of the chart are straightforward: investing in a global equity index today compared to 10 years ago means having more than 16% higher exposure to the U.S. We would argue that such a concentration, despite the importance of a range of global companies that are domiciled in the US is unlikely to be sustainable over time. Sometimes, mismatches, such as in the 1980s and Japan, can be severe. Once a 40% weighting in the MSCI, Japan declined after its real estate bubbles and only has a 5% weighting today.
Concentration
The growth in the share of MSCI to the US could be less problematic if it weren’t for the concentration of a relatively small number of companies.
The following chart shows that excluding the Magnificent Seven (Microsoft, Amazon, Meta (Facebook, etc) Apple, Alphabet (Google), Nvidia, Tesla – blue line), the S&P493, that is, the S&P less these seven stocks, has not experienced as significant a level of growth compared to the rest of the world is implied by the increase in MSCI share.
Figure 2: MSCI USA weight in major global benchmarks

Source: Minack Advisors.
The combination of strong global flows into the US, combined with fabulous performance in a range of key economic indicators, has meant that investors in the US are now paying significantly higher amounts for the earnings of the companies listed in the US. Put another way, US stocks are expensive.
Expensive?
How expensive US equities are in general is again dependent on a distinction between the seven largest companies and the rest, as shown in the chart below, in which the S&P493 PE ratio (red line) is elevated, even after removing the impact of the Magnificent 7 (blue line). All other markets (yellow line) are much cheaper.
Figure 3: Magnificent Seven PE compared

As we have noted in recent months, part of the higher price paid for US stocks is due more substantial earnings growth. The performance of the US economy continues to be strong, and we are excited about emerging investment trends and the adaptive capacity of US firms.
When we combine the price (PE ratio) and the expected growth levels in a single chart, a solution to the imbalances described emerges. The chart below (Figure 4) shows the expected growth in earnings (EPS) along the horizontal axis versus the price paid in PE on the horizontal axis.
The optimal ratio over which to trade off growth for price is a debate for another day, but in general, we would look to invest in markets that were cheaper and offered similar growth.
If we look closely at the difference between the S&P400 and the S&P500, we see that both options (S&P400 is a subset of the S&P500) have similar growth, but the S&P400 is much cheaper. Indeed, from a 15-year point of view, the Forward PE of the SP500 is elevated (seen Figure 3, above), whilst the Forward PE of the SP400 is slightly lower than average.
Figure 4: P/E versus EPS growth

Source: Goldman Sachs, FactSet.
We have chosen to invest in the S&P400 at a higher rate than a standard MSCI allocation.
Figure 5: A “Trump Bump” in investor sentiment

The other prominent characteristic of Figure 4 is that Europe, Japan and the UK are much cheaper markets, but they also have much lower levels of growth. We would argue that this discount is too significant now, but we do not expect the discount to completely close across our investment horizon.
The decision to actively increase our allocation to Europe and Japan is also based on relative changes in the European and Japanese economies. Critically, we are seeing real wages grow for the first time in several years, but spending has yet to pick up, suggesting earnings growth in Europe and Japan is likely to accelerate.
Figure 6: Europe: Consumer spending lagging income

But isn’t the market right about something?
Yes. This piece does not suggest that the high prices currently paid for notable companies such as Nvidia and Microsoft is based on sound logic. Through global index positions, our clients already own a sustainable amount of these companies.
We do not believe owning as much as dictated by the market indices is wise.
In conclusion, our approach has seen us lower the concentration of investment in the largest of the overpriced US equities, increase the reasonably priced S&P400, and increase our exposure to Japan and Europe. We believe that the resultant portfolio is prime for higher risk-adjusted returns, as well as better placed to achieve the diversification benefits we are seeking from our International Equities exposure.
Beach Energy (BPT) – 1H25 Result – Negative- Share Price down 10%
Beach Energy released its H1 FY25 results on Thursday, and it was a genuine mixed bag, with the market reversing the almost 10% gain from February. In this update, we hope to provide some nuance surrounding the competing issues to emerge.
The company
Beach Energy is a mid-cap oil & gas producer headquartered in Adelaide. Legacy operations are in the Cooper Basin, Victoria (Otway & Bass basins), New Zealand (Taranaki Basin) and Perth Basin. It is currently completing the construction of a second phase project at Waitsia in the Perth basin (50% Beach, 50% Mitsui), it will 2025 see the company exporting LNG for the first time.
The 1H FY25 results were broadly in line with expectations, and there was growing evidence that the new leadership team delivered strong commercial results. Strategic decisions regarding the pre-sale of future cargo appear financially advantageous and commercially astute. Cost control, which has been the mantra of the new management team and the focus of SGH (i.e. Seven Group), the 30% majority shareholder, has been delivered with gusto.
We suspect that if these factors were the only consideration, the stock price would have risen rather than fallen.
However
The value of Beach Energy’s share price is only partly the result of strong operational outcomes for existing projects. The remainder lay in the successful deployment of the Waitsia Stage 2 project, the capacity for the company to expand its existing assets and critically managing the cash back to shareholders in a decisive, consistent manner.
Beach Energy targets a fully franked dividend payout of 40-50% of underlying free cash flow (FCF) (pre-growth capex). During this period however, the company chose a much lower payout ratio, raising questions about a) what the company intends to do with the cash instead, and b) whether it is confident in completing the Waitsia project on time and on budget.
The successful start-up of Waitsia Stage 2 remains the central issue for Beach Energy; most of the capex has been spent, and it is now in the commissioning phase. Further delays in introducing fuel gas to the Waitsia plant were negative news from the result. In the long run, there is probably no loss of value, but given the importance of the project, even minor delays reduce market confidence.
The chart below shows an approximate breakdown of the value of Beach Energy by asset.
Figure 7: Beach Energy: Sum of parts – Value by asset

The Waitsia Field is believed to be the largest conventional Australian onshore gas discovery for more than 30 years. It provides impetus and incentive for continued exploration in mature and frontier basins.
Figure 8: Waitsia Field: Where is it?

Why a lower dividend?
The disappointment in the result was a slightly lower dividend. As investors, we would be the last firm to criticise a company for choosing conservatism or additional investment instead of paying a dividend. Indeed, a good deal of the underinvestment in Australia is driven by franking-driven excessive payout ratios.
However, when a firm such as Beach Energy states that it intends to maintain a higher payout ratio and fails to do so questions are raised. We agreed with broker sentiment that the “most plausible explanation of underpaying dividends… is that it is retaining A$100-150m from dividends to fund M&A, or …. others’ exploration in Otway Basin”.
We would be disappointed with either.
We still see the same value in BPT longer term (forecasting a free-cash flow yield of greater than 20% in FY26+) but we expect the discussion of M&A and balance sheet will weigh on the stock.
We will remain patient, and especially given the stewardship of the current management team and the influence of Seven Group Holdings, we expect that return on investment and future cash flows will ultimately create significant value.
The information in this article is of a general nature and does not take into consideration your personal objectives, financial situation or needs. Before acting on any of this information, you should consider whether it is appropriate for your personal circumstances and seek personal financial advice.