
Read the previous week’s Investment Matters.
Photo © AndreyPopov from Via Canva.com
Copyright 2025 First Samuel Limited
The Market
‘Liberation Day’
Takeaways
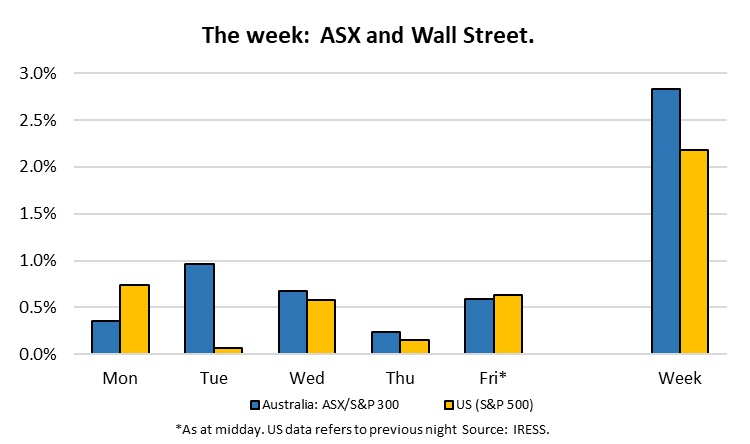
- The ASX has recovered but is still down about 4% from its January high
- Economies, companies and markets will adjust to the new tariff regime, eventually
- But the transition may be more painful
- We expect opportunities to continue and client portfolios to continue outperforming
The longer story
Liberation Day (the day Trump announced his tariff increases) was less than one month ago.
In that time, the ASX market fell more than 6% at the close on April 6th but recovered more than 10% before the end of the month. But remain about 4% lower than its January peak.
Market uncertainty peaked with the ‘LD’ announcement and has improved since.
Regardless of the reduced uncertainty, the world has changed, if only for the range of possible future scenarios that are becoming more diverse. The consequences are yet to be quantified.
The concern as we advance isn’t that the economies, companies and markets won’t adjust to changing geopolitical and trade flows – they will. The risk is that the transition is more painful, and the short-term economic impacts are larger than expected.
The complete rebound in global markets is too dismissive of these short-term risks. Oil prices and bond yields, which continued to fall, are more circumspect.
Underneath the recovery, there have been distinct trends in market impacts across various sectors. Some of the sectors of the market that have been rewarded, simply because they offer short-term protection from uncertainty, are overpriced.
We expect ongoing price variation between ASX constituents to dominate the run-up to year-end, allowing client portfolios to continue outperforming.
Markets and we are not expecting any impact from the federal election. So that the investment team will enjoy their Saturday polling-booth BBQ sausage in peace.
Bank portfolio update
Participants in our CIO event series late in calendar 2024 will recall our thesis that Australian major bank shares are:
- currently not a particularly attractive for investment with hard-earned wealth; and
- diversifying their lending spread away from residential property
A. Australian major bank shares – still not enticing us
Major bank share prices were seemingly ‘defying gravity’ in calendar 2024 relative to declining profitability and earnings and dividends growth. However, we felt that gravity began to do its thing late in the calendar year in 2024. This retracement of relative share price performance against the market has gathered a little more pace in the new calendar year.
But with greater than 20% of the Australian share market index being allocated towards major banking stocks, it remains an important decision-making factor for both the absolute and relative performance of our Australian equities sub-portfolios.

A crash course in the Fundamentals of Banking
Banking is a heavily-regulated sector of the economy. As a facilitator of lending, payments and trade flows, banks have strict conditions upon the way they operate their businesses.
There are several types of risk that banks incur. These include:
- Credit risk (the risk of not getting paid back when they lend or guarantee payment)
- Market risk (due to movements in interest rates and/or exchange rates)
- Liquidity risk (difficulty accessing funds)
- Operational Risk (e.g. internal systems or procedural failures)
Reflecting these risks, global and local banking regulators require banks to hold a buffer of equity capital as a means of absorbing loss when these risks are encountered/incurred and loss suffered.
The higher the level of risk taken by a bank, the higher is the level of equity capital required. If a bank holds excess capital above a prescribed regulatory minimum, this excess can be returned/paid out to shareholders in the form of dividends.
It is obvious that the higher a company’s return on its equity capital (ROE) the greater will be its dividends. And hence greater share price.
But this isn’t quite the logic of what some of the investors in the Australian sharemarket (both local and international) have been applying as they valuing/price Australian major bank shares.
Share prices have been rising more than earnings.
Australian major bank operational performance and valuations
When we examine the financial and operational performance of the Australian major banks, the story is not quite as stellar as the share price story has been.
Taking the period from just preceding the Haynes Royal Commission into Misconduct in Banking right up to the end of FY24, the sector has struggled to grow its earnings.
The sector’s returns have, in fact, declined.
Even the much-vaunted Commonwealth Bank, the best performed and most successful of the Australian major banks, has seen a stagnation of profit growth and a decline in returns.
As you can see from the below table, in the last seven years, CBA’s share price has grown an average 6.3% p.a. But its cash profit has not increased, its earning per share has increased by only 1.2% p.a. and its ROE has declined by 2.3% p.a.
Figure 1: CBA – when logic no longer applies (current price $164 per share)

Source: Company reports, First Samuel estimates
A similar, but not so extreme, picture is seen for the other major banks.
So, it is difficult to reconcile why Australian major bank shares are more highly priced today than their own history and versus their global peers.
Yet that is precisely the situation we observe in the market, with CBA being the standout case with difficult to fathom levels of overvaluation.
Bank Valuation metrics
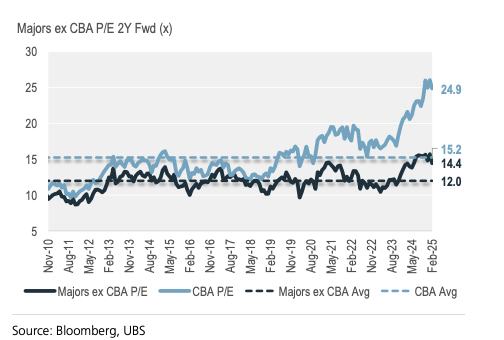
The below left-hand chart (inconveniently labelled Figure 4) shows CBA’s P/E (light blue line) compared to the other major banks (dark blue line).
The right-hand chart (Figure 20) shows that the major banks price to ‘pre-provision profit’ ratio (sort-of P/E) has leapt since 2022. And is well above the usual bands of +/- one standard deviation away from the long-term average.
Fig 2: Majors (ex CBA) PE vs CBA P/E and Figure 3: Banking Sector Price to Pre-Provision Profit

The other significant measure of value for a bank is its price per dollar value of the book value of its assets, Price to Book Value. Again, the CBA is a standout over-valuation compared to the other banks (left-hand chart, figure 5). And (right-hand chart, figure 6) the Price to Book for all the banks (dark-blue line) has leapt ahead of the banks’ ROE (light blue line). In fact, their ROE has declined slightly.
Figures 4 and 5 : Major Banks Price to Book relative to Return on Equity – misaligned


B. The shifting tide of credit flows and the economy
Critics of Australia’s recent economic performance would note that nominal growth in the economy in recent years has been driven largely by population expansion and that investment into productive capacity has instead been invested into land and housing stock.
One may argue that the foundations for Australia’s weak productivity performance in the past decade has been a long time coming. For most of the past 30 years, there has been a significant shift in bank lending and focus by individuals and businesses towards funding property development and speculative borrowing into property. This can be seen in the chart below, which shows how accommodative banking regulation and taxation policy has spurred rapid expansion of mortgage credit in Australia.
Business credit is at the same levels as 40 years ago.
Figure 6 : Mortgage and Business Credit to GDP since 1860 (%)

Source : Barrenjoey, ABS, RBA
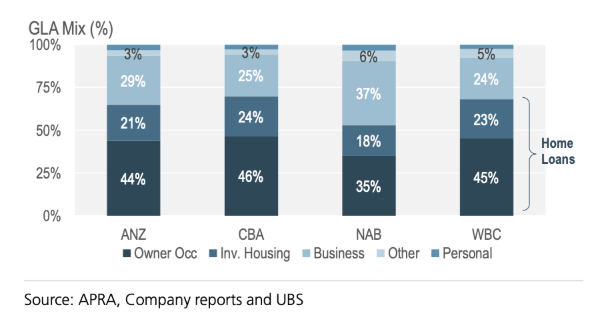
This means that Australia’s major banks now have most of their lending dedicated to mortgages. One may argue that the banks have turned themselves into glorified building societies!

The below chart shows the significant reliance of the banks on home loans.
Figure 7 : Loan Book split by Bank
The tide has turned – commercial lending is now in vogue
As the following charts (figure 11) demonstrate, the economics of borrowing for housing, at current house prices and at current ‘normalised’ interest rates, is simply now out of the reach of many households in the absence of parental assistance.
Figure 8: Capacity to Pay for Housing
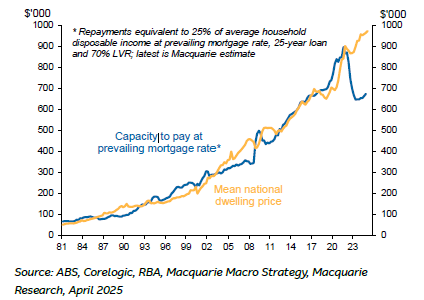
With commensurate slowing demand, banks have competed more aggressively for new mortgage business. As they competed they drove down the profitability of mortgages. The economics of bank lending is finally creating more lucrative lending opportunities in commercial lending.
Even though the capital that banks are required to more capital against a higher/riskier business customer, higher lending spreads (difference between the rate that the customer is charged and the bank’s blend of funding sources) is finally making sense in terms of return on equity.
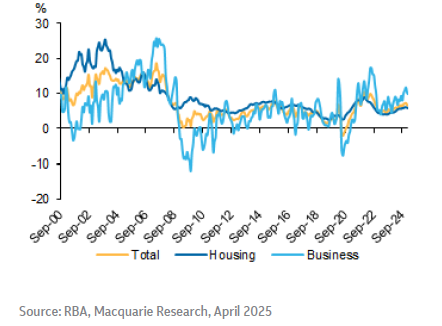
Lending to commercial customers is no growing at a faster pace than for mortgage lending. This has happened very infrequently since the Global Financial Crisis and even since the earliest days of banking de-regulation in the 1980’s.
Figure 9: Bank lending growth by type
Summary
Banks allocating more capital towards lending to businesses increases the risk of their lending book mix. But we believe this situation is a preferable and healthier development from a broader perspective of the Australian economy. Investment in the stock of housing, while necessary to provide accommodation, is adding little to the productive capacity of the economy. It should also not be providing superior returns on capital for investors.
From an investment perspective, our preference to capture this shift in the lending base has been to allocate money towards Judo Bank (JDO), as a dynamic and specialist/focussed business banking player. This has been a successful investment strategy for us in the past 12 months.
The information in this article is of a general nature and does not take into consideration your personal objectives, financial situation or needs. Before acting on any of this information, you should consider whether it is appropriate for your personal circumstances and seek personal financial advice.