
Copyright 2026 First Samuel Limited
Read the previous Investment Matters here.
In this week’s Investment Matters, we highlight the challenge the war in Iran presents to market sentiment, global policymakers, everyday businesses, and consumers.
This week’s in-depth discussions of last month’s reporting season will focus on another three of the larger portfolio positions, including Santos Limited, Woolworths, and Life360. In the following weeks, we will finish off the remaining positions, including Nanosonics and Inghams.
The Market
Iran War challenges market sentiment
In a market that moves at the speed of light, today’s data is often tomorrow’s history. While these insights are fresh at the time of writing, the world may have shifted by the time this hits your browser.
Since Saturday, February 28, 2026, when the United States and Israel launched coordinated airstrikes against Iranian military, nuclear, and government sites, and killing Supreme Leader Ayatollah Ali Khamenei, markets have had 12 days to process the outcomes.
A spike in oil prices late last week only highlights the risk to both short-term economic conditions and the long-term risks of a protracted conflict. Following a ramshackle speech by President Trump on Tuesday morning, Australian time, there appeared to be the promise of a break in hostilities. However, by the end of the week, the scope of ongoing US/Israel action, and subsequent Iranian reactions, brought the earlier Trump commentary into sharp focus. Just how long will this conflict last, and what remains are core aims, have become the principal topic of discussion
The chart of oil prices over just the past five days, a full week since the opening of the conflict, shows the tremendous uncertainty regarding the duration of hostilities and structure of global geopolitics. Within five days, the global price of oil (Brent) has ranged between $81 and $117 per barrel.
Figure #1: ICE Brent Crude Oil price March 9th to March 13th
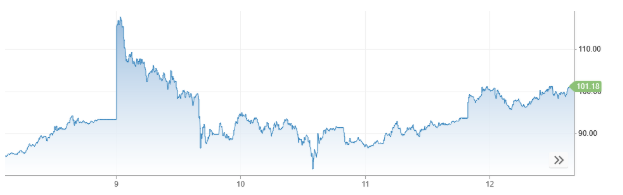
Source: Trading Economics
It perhaps goes without saying that certainty and clarity are the losers in a market where energy prices are so volatile.
In markets, we spend a great deal of time judging the agency of principals. We ask whether management teams understand not only the intended outcome of a major decision, but also the second- and third-order consequences that may follow.
The problem with the war in Iran is that it is not yet clear whether President Trump has demonstrated that level of discipline. This week has seen shifting public rationales for the strikes and a still-vague endgame, even as the campaign risks becoming the largest U.S. military operation since Afghanistan and Iraq. For investors, that matters. A principal does not earn confidence merely by acting decisively; confidence comes from evidence that the decision-maker has thought through escalation, spillovers, and the conditions for exit.
There are clearly identifiable military aims: degrading nuclear and military infrastructure, damaging command structures and attempting to restore deterrence. But there is much less evidence, at least in public, of a stable political end-state that follows from success.
If we have a deficit of discipline, and let’s hope we don’t, it will have two impacts: short-term and long-term. The short term includes the tactical and the impact on prices and interest rates. The long-term impacts of prolonged conflict include accelerated change in global leadership dynamics, permanently higher inflation, further balkanisation of energy markets, and higher long-term interest rates.
The most obvious example of military aims ignoring non-military outcomes is that it seems no one in the administration had war-gamed a closure of the Straits of Hormuz. Or if they did, they did it badly.
The clear, not-thought-through consequence is that economic damage can spread much faster than military damage. That is why so much of this week’s discussion centres on the Strait of Hormuz, through which nearly 20% of global oil and LNG flows normally pass, and which has seen tanker traffic collapse, insurance costs surge, and Iraqi production fall sharply as exports were disrupted. In other words, even if the battlefield remains geographically narrow, the economic theatre broadens almost immediately.
The impact of Hormuz on oil prices is direct and straightforward, as shown in the following chart.
Figure #2 Spot Oil and Tanker movements
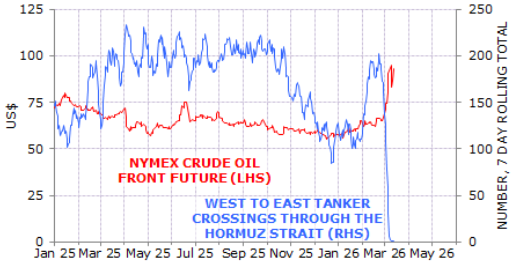
Source: Minack Advisors
Markets will respond positively to good news from the Straits of Hormuz and vice versa, for as long as the conflict endures. Oil is traded globally, and whilst significant work can be done to maintain global oil flows through reserve releases and increases in production in other markets, the price impact of removing oil from the Straits of Hormuz cannot be avoided.
Most countries, including Australia, import a great deal of their domestic petroleum products. Global prices will prevail, and shortages in key products such as diesel are already affecting the Australian economy.
In another excellent chart from Minack Advisors, we can see two key long-term data points that provide historical context. The first is the red line showing inflation-adjusted (real) oil prices (West Texas Intermediate) since 1960. My takeaway is that we have enjoyed a peace dividend in oil since the mid 2010’s and a rise to $100 per barrel wouldn’t be record levels in real prices, but would certainly impact prices, inflation and domestic economic activity.
Figure #3 Global oil consumption
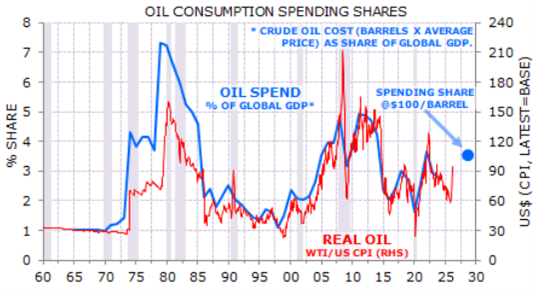
Source: Minack Advisors
The second definite short-term impact is inflation. Higher oil prices are not just a commodity story; they run through freight, aviation, chemicals, food and household budgets. This is especially the case in the US, with additional direct employment effects coming through housing activity. Inflation pressures short and long-term interest rates. The problem for the globe is that, unlike the early 70’s, global debt levels are vastly higher. Rises in interest rates hit harder at much lower nominal levels than ever before.
Bear in mind that, despite low interest rates the interest burden on Australian households is at record levels.
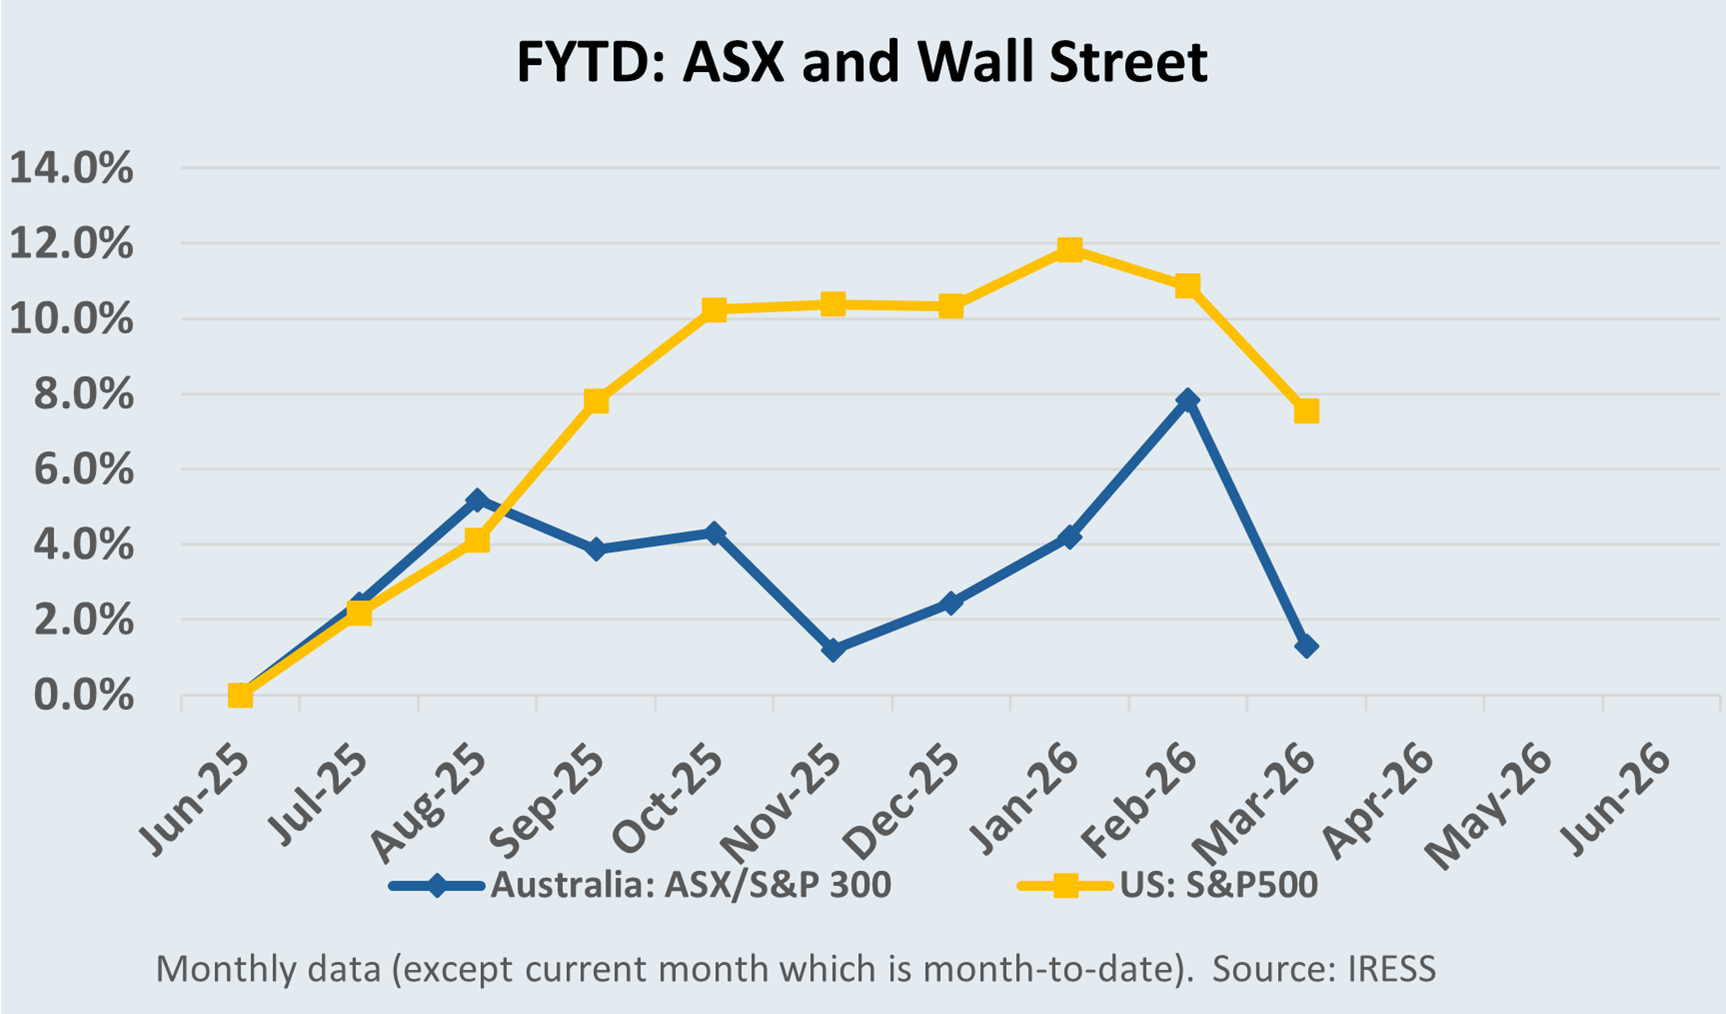
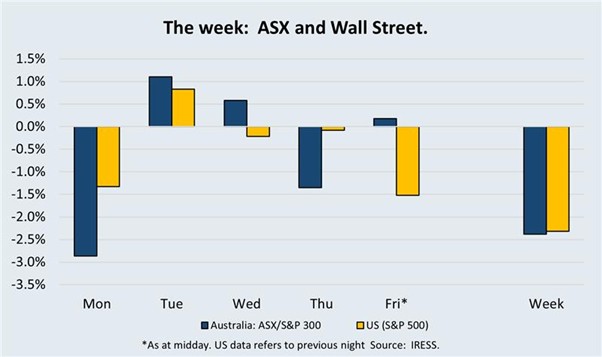
So what has happened in Australian markets
It was a broad-based de-risking event, initially triggered by surging oil prices and heightened geopolitical tensions in the Middle East. When combined with recent weakness in software names in response to the pressure of AI, the market is searching for safety. In January and February, obvious safety was found in solid global industrial companies, innovative mid-cap companies with hard assets and gold miners.
In risk-off trades, we generally see larger price falls in smaller companies, not particularly due to the operations of the companies themselves, but rather the appetite of buyers for lower liquidity and less stable earnings. This trend was magnified in the Australian market.
The ASX sell-off reflected at least three separate forces: a geopolitical oil spike, renewed inflation fears, and a weak U.S. payrolls backdrop, which raised concerns about a stalling labour market. These are not interchangeable shocks. One is a supply shock, another is a demand shock, and a third is a geopolitical risk premium. Markets often price them together initially, but their persistence will differ materially.
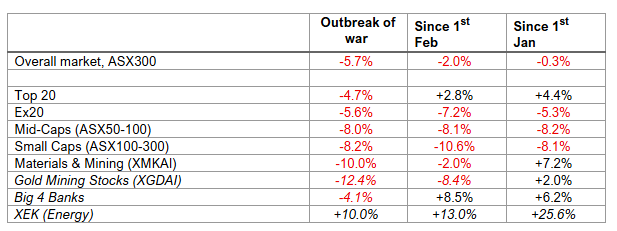
The share price reaction at the overall market level of -5.7% belies the underlying movements in key areas. There was no protection in owning gold-mining stocks, which have fallen the fastest, so we continued to lighten our gold position through January. Materials and mining fell precipitously as concerns about global growth and China’s impact were at the forefront. All smaller companies, in fact, all parts of the index outside the 20 largest companies, have fallen considerably further than the 20 largest companies. The outperformance of the largest stocks reflected a knee-jerk if difficult to justify, rush to the short-term safety of the Big Four Banks.
If a genuine U.S. growth scare takes hold, or if Chinese demand for steel and iron ore weakens from current price-supported levels, then the implications become far more durable. This week, the reliance of China and the rest of Asia on oil through the Strait of Hormuz is often mentioned. The impact of this growth was felt directly by Australian mining stocks since the outbreak of war.
Weak global growth, especially fractured Chinese demand, would hit Australian national income, fiscal revenues, and mining cash flow, and then feed through to credit growth, housing turnover, and confidence.
The distinction between supply shock, global demand shock and geopolitical risk matters even more for Australia. If the oil move proves temporary, it may matter mainly for headline inflation and short-term risk appetite. The RBA would tend to look past the fuel price shock and instead look for any sustained increase in inflation expectations. Prolonged inflation could increase inflation expectations and lead to higher interest rates at the exact time households cannot afford them.
In that scenario, the recent price action in Australian banks looks too casual. Flight to safety can explain early strength in Australian banks. But it does not explain why bank valuations should remain so elevated and continue to rise in 2026, if weaker global growth feeds through to softer domestic credit creation and less support for house prices.
It is interesting to note that globally, banks have been much weaker than the Australian experience.
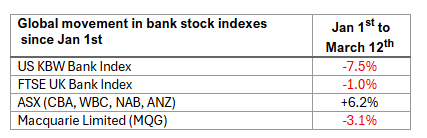
Whilst long-term Australian bond rates may rise, especially in an environment where global long-term interest rates rise, the Australian short-term interest rate set by the RBA remains lower. This is critical because, unlike in the US, where mortgage rates are based on the 10-year Treasury rate, Australian mortgages are priced off the RBA’s short-term cash rate. We see a possibility that the RBA could maintain lower cash rates, thereby protecting households.
If this balance is to be sought, the role of government and policy reform will be even more important. At exactly the wrong time, we have a decade of weak overall productivity performance, which increases domestic inflationary pressures.
Many have said, and we concur, that this upcoming May Federal Budget may be the most consequential of the past decade, and the headlines alone will not be the true measure of its success. The scope of structural and fiscal reform required is vast. We suspect little will emerge, placing additional pressure on younger Australians left to pick up the pieces of inaction.
Opportunities for buying and patience
With long-term investing in mind, we note significant declines in a range of high-quality stocks over the past month. Many of these stocks have had strong results around earnings seasons, with share price appreciation that has since reversed. Pointing to the following table for good examples of strong global franchises or domestic businesses with market strength, along with recent share price movements.
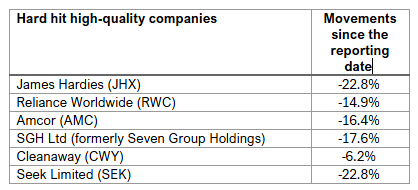
Collectively, approximately 15% of clients’ portfolios have fallen by 13%. Yet we would argue that each is in a stronger position than before their result. The first two on the list, JHX and RWC, are both exposed to US housing market trends, and we would note that the broad US Homebuilders Index is off 16% over the same period since the beginning of February. US Markets fear the worst for this sector as a casualty of the conflict. We remain convinced of their long-term value.
The inclusion of Seek Limited in the table above is an example of the AI-related technology sell-off, a trend accentuated by the conflict. We believe the CEO and management team, in their meetings with the market, did the best job of explaining the opportunities and threats from AI to their business model. In pure valuation terms, SEK has the most upside of the Australian-based technology names we cover. And should the worst-case scenario play out for Australian employment and household incomes, arguably the most at risk would be highly geared Australian banks with exposure to credit risk, rather than high-margin, profitable technology companies. such as Seek. However, since the start of February, the opposite occurs.
We are inclined to believe that in the absence of conflict or when a feasible path forward is presented to the world, a number of these trends will reverse.
On balance
We are pleased to have entered this period of volatility with clients’ accounts holding high levels of cash. Whilst the market and the overall ASX300 index have rotated towards safety in Australian banks, we have chosen to generally maintain high cash levels instead.
Whilst this has cost us in relative performance, it has also provided us with opportunities
We have been undertaking selective stock purchases and broadening the portfolio. A range of defensive or globally oriented industrial companies, including Amcor, Orara and Metcash, have provided good opportunities to build value.
We have also been adding to a range of other names, including an exposure to the Australian Technology Index (ATEC), which has fallen 35% since mid-2025.
Santos: Great full-year result + Iran War
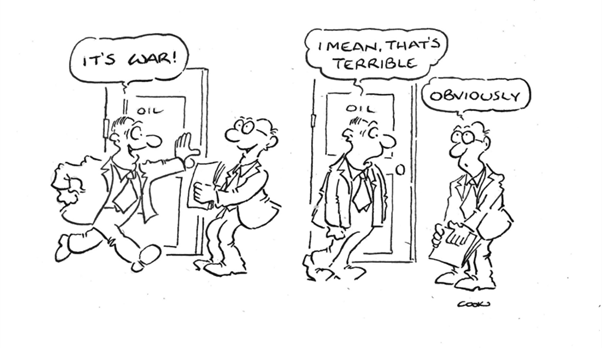
Patrick Cook’s brilliant cartoon is a perfect introduction to a review of Santos’ FY25 results released during February. The reality is that rising geopolitical risk, followed by the outbreak of war, has contributed to a 25% rise in the Santos share price since 1st January.
Santos is our largest oil exposure, and the First Samuel equity portfolio is slightly overweight energy stocks (above the index’s concentration).
The thesis for our ownership of Santos is relatively simple. Great projects, oil exposure, lower operating-cost model, and optionality with respect to future projects. Lower operating costs, with break-even cash flow from operations at only $27.40 per barrel, provide protection in periods of low oil prices.
Figure #4: Santos, low-cost operator: Free cash flow break-even from operations, $boe
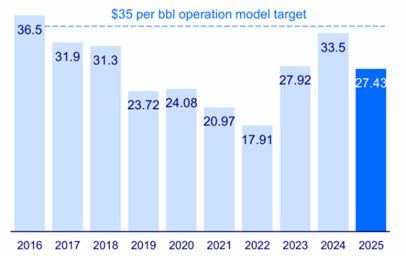
Source: STO FY Result Presentation
A commitment to maintaining lower costs drives a development pathway that is less aggressive than other global operators. But the quality of their future growth options in Barossa, Papua New Guinea, Pikka, and the Beetaloo Basin all represent the optionality we appreciate, especially when their value is not fully reflected in the current share price.
Over the next 3 years, existing projects entering ramp-up are expected to generate strong cash flows, even before benefiting from potential upside from short-term movements in oil/gas prices.
As a result, the following figure shows the expected high levels of free cash flow expected in February. In 2029, UBS projected Santos to generate a free cash flow yield from operations of more than 10 per cent. And these cash flows are significantly leveraged to movements in oil prices. We concur with that projection and as such find significant valuation support at current levels.
Figure #5: Near-term cash flows are highly supportive of the STO share price.
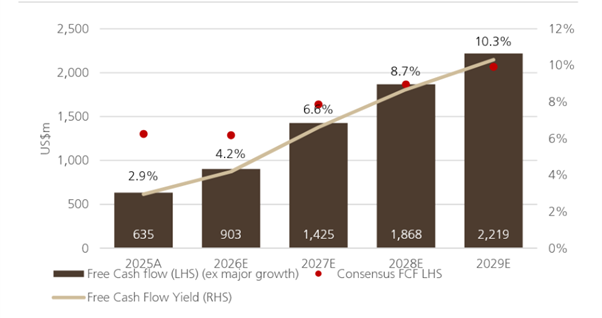
Source: UBS Research, STO company reports.
Generating cash flow is one element of a successful energy company, but perhaps the more important is the ability of said company to use the funds wisely. For this reason, we were especially pleased with the management update regarding the strategic priorities.
Below the management presentation, eight objectives for the next 3-5 years are repeated. Not only are they well aligned with the way we have modelled and valued the company previously, but they are demonstrative of the scope of value-creating options that are possible.
Figure #6 Strategic priorities aligned with First Samuel investment objectives
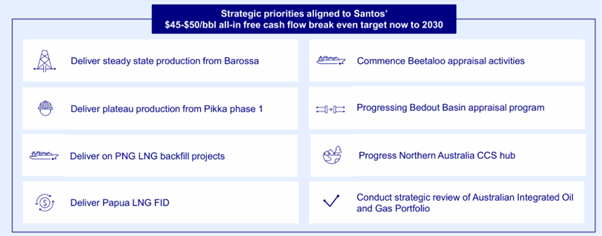
Source :STO1HFY26 Result Presentation
We are especially excited about commencing the Beetaloo appraisal—a “potentially transformative opportunity for STO and Australia”. Santos hints that a full-scale development could reshape its LT production profile, potentially backfilling both its Australian LNG projects, including Darwin. With the Barossa LNG project now shipping its first cargoes as of January 2026, Santos views the Beetaloo Basin as a key future source of gas to extend the life of the Darwin LNG plant.
Once again, there is rarely upside to conflict; the art of portfolio design is diversification, and having high-quality energy exposure, such as Santos, along with others like Beach Energy, tends to play a positive role when you least expect it.
Woolworths Limited 1H25 Results: Winning back the customer
Woolworths Limited released its FY25 results on 20th February.

We love this result.
What was new in this result was the degree to which management could point to concrete evidence of better execution. CEO Amanda Bardwell said Woolworths had held more stock on key promotional lines, increased weekend store deliveries, unlocked an extra one million online delivery and pickup slots in December, and sharpened the group’s “one customer plan” across commercial, loyalty, operations and supply chain. She also acknowledged that prior leadership and structural changes had caused disruption but argued that the business is now more focused and faster to respond.
At the core of running a supermarket well is providing customers with appropriate value. For decades, research has shown that when Australians are disappointed with the value, they change their behaviour. Eating and cooking more at home from scratch, buying home brands, and increasing the share of products bought on special are options. But so too do disappointed customers reduce patronage to the supermarket brand that has disappointed them most. For the past year, that brand was Woolworths, and when this was combined with outages and industrial disputes, the impact was significant.
New investment in price, execution and product availability appears to have reversed sentiment very quickly. In the 1HFY26 result group sales rose 3.4% to $37.1 billion, EBIT before significant items increased 14.4% to $1.66 billion, and underlying NPAT rose 16.4% to $859 million. The interim dividend increased 15.4% to 45 cents per share. The market’s reaction was emphatic, with shares jumping sharply on the day as investors responded to a result suggesting Woolworths is finally regaining momentum in its core supermarket business.
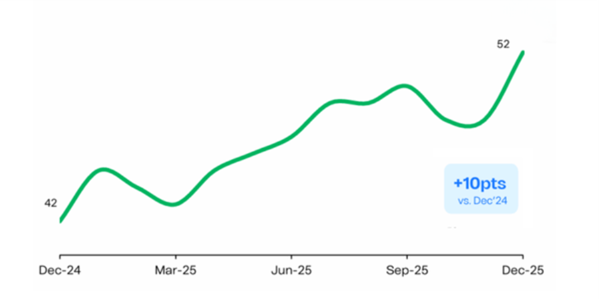
The most important feature of the result was not simply the earnings beat, but the evidence that customer outcomes are improving. Woolworths said, “all customer metrics have improved,” with trading momentum stronger and market share stabilising. In Australian Food, the Voice of Customer Net Promoter Score finished the half at 52, up 10 points from the prior year, while store-controllable Voice of Customer improved by five points. Management said this was driven by better availability, stronger value-for-money scores, fewer out-of-stocks and improved fruit and vegetable execution. In other words, Woolworths is arguing that the turnaround is being built on improved retail fundamentals rather than on accounting leverage or easy cost-cutting.
Figure #7: Woolworths Food Retail Survey Scores – Voice of Customer (VOC)
Source: WOW 1HFY26 Results Presentation
That matters because heading into the result, one of the market’s key debates was whether Woolworths’ apparent improvement would prove superficial. Commentary before the result highlighted Australian Food as the division to watch, especially because Woolworths was still lagging Coles in sales growth and was only just beginning to cycle through the prior year’s industrial action disruptions. We wondered whether a stronger sales trend, benefiting from strike-related comparisons and easing food inflation, might be hard to sustain unless execution and sentiment improved.
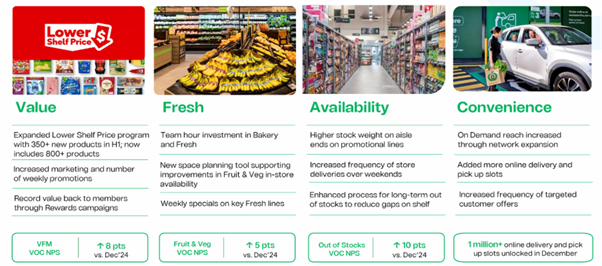
The following graphic shows the breadth of improvement Woolworths was able to achieve.
Figure #8: Momentum returns in Woolworths Australian Food Retail
Source: WOW 1HFY26 Results Presentation
So what is the impact on our valuation?
For nearly two decades, we have concentrated on two core issues in our analysis of supermarket valuation: sales per square metre and adjusted EBIT margins. Higher sales per sqm defray costs, accelerate price differentiation, and leverage supply chain benefits and sourcing efficiency. Woolworths once maintained a significant lead in sales per sqm.
As Woolworths lost ground, Coles’ sales per sqm are now expected to be 1% ahead of Woolworths’. We believe that the quality of the Woolworths network means it can not only catch up but, once again, surpass Coles’ sales per sqm. We remain of the view that Woolworths has a higher concentration of A-grade stores despite evidence that its recent growth corridor and smaller offerings may be dragging down overall sales efficiency.
To maintain strong EBIT margins, we need high sales per sqm, strong selling prices that lead to higher gross margins, and, more importantly, for a modern supermarket, well-controlled CODB (cost of doing business). The following figure highlights the CODB % of sales since 2021 and the relatively weak performance of Woolworths’ CODB; the higher the CODB, the worse for profitability. 1H25 CODB of 19.6% was so high that we lost faith in the current management team.
Figure #9: WOW Australian Food, Cost of Doing Business (CODB) / Sales %
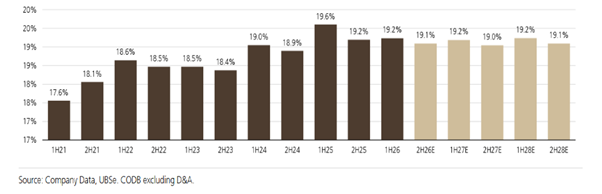
Source: Woolworths company data, UBS Research
The improvement seen in 1H26 was therefore critical to our investment thesis. A duopoly supermarket with amazing supply chains and strong investment in omnichannel retailing (including delivery) owes its shareholders exceptional cost control.
The fact that Woolworths guided full-year 2026 Australian Food EBIT margin consistent with a recovery in cost control was pleasing, but there is more to prove. The key to cost control in supermarkets isn’t the need for higher profit margins, but rather the extent to which lower costs can be reinvested in price and customer satisfaction or retained by shareholders. Poor cost control removes this option, thereby reducing long-term value.
Life360: 1H26 Results
Life360’s recent results were strong in absolute terms, even if the market initially focused on guidance nuances rather than the quality of the underlying numbers. For FY25, revenue rose 32% to US$489.5 million, annualised monthly revenue increased 30% to US$478.0 million, and adjusted EBITDA more than doubled to US$93.2 million. Just as importantly, the company reached its first full year of positive net income, marking a clear step in the transition from high-growth platform to scaled, profitable business.
The Life360 share price has suffered from the sell-off across technology names. Clients should note the large proportion of the position sold near peak levels.
Operationally, the result showed that Life360 continues to build both scale and monetisation. Monthly active users reached 95.8 million, up 20% year on year, while paying circles increased by 576,000 over the year to 2.8 million. That combination matters because it shows growth is not just coming from a larger free user base; the company is also converting more families into higher-value paid subscriptions. Management argued that 2026 should bring further momentum as subscription growth continues and the advertising business scales.
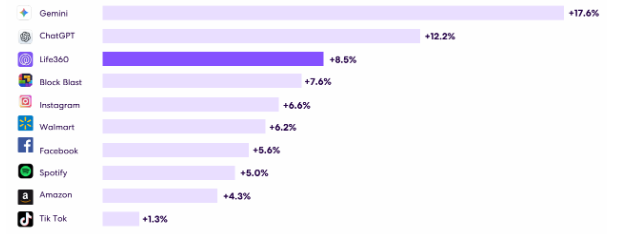
We appreciate the following figure showing how parents in the US are embracing Life360 app usage. In Dec 2025, Life360 sat only behind Gemini and ChatGPT in app growth.
Figure #10: Amongst the fastest growing app for parents in the US, Dec 2025
Source: Life360 company presentation
Guidance for FY26 was also solid. Life360 expects consolidated revenue of US$640 million to US$680 million, adjusted EBITDA of US$128 million to US$138 million, and global MAU growth of 20%. At the midpoint, that guidance was modestly ahead of consensus, but the wide range and some investor concern about the pace and mix of growth appear to have driven a weak initial share price reaction.
Potentially, there was scepticism about the ability to pursue additional opportunities, like pet tracking or elderly monitoring, but it’s arguable whether any of these adjacencies were ever reflected in the share price. The figure below shows the progression of future opportunities that management sees in front of Life360
Figure #11: Life306 growth options
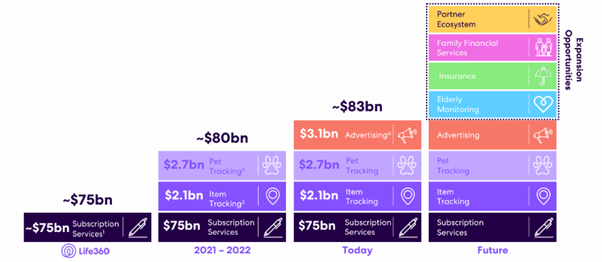
Source: Life360 company presentation
We were especially excited about the first-time inclusion of information about the company’s fast-developing advertising platform in the results. We saw rapid growth in Other Revenue, mainly from advertising-related sources. We see the potential for Life360 to be a global-scale platform for advertising content delivery, not only within the Life360 platform. Ultimately, delivering advertisements that carry the knowledge, logic, and tracking capabilities of the Life360 technology across a vast range of websites, apps, and platforms is how value is created. The best example is the way in which Google (and everything Google knows about its users) is currently the advertising service that delivers ads to unrelated websites from your local newspaper’s website to pop-ups in the plethora of apps used daily.
During Life360’s Q4 2025 earnings call, “off-platform” inventory was defined as advertisements served on third-party websites and apps. This revenue was enabled by the acquisition of Nativo, which expanded beyond the company’s own application. This strategy utilises proprietary location data to target ads across external publishers, allowing Life360 to monetise passive users while proving ad effectiveness through real-world visit data.
We suspect that more than 40% of the long-term value of Life360 shares will be advertising platform related.

The information in this article is of a general nature and does not take into consideration your personal objectives, financial situation or needs. Before acting on any of this information, you should consider whether it is appropriate for your personal circumstances and seek personal financial advice.