
Copyright 2025 First Samuel Limited
Introduction
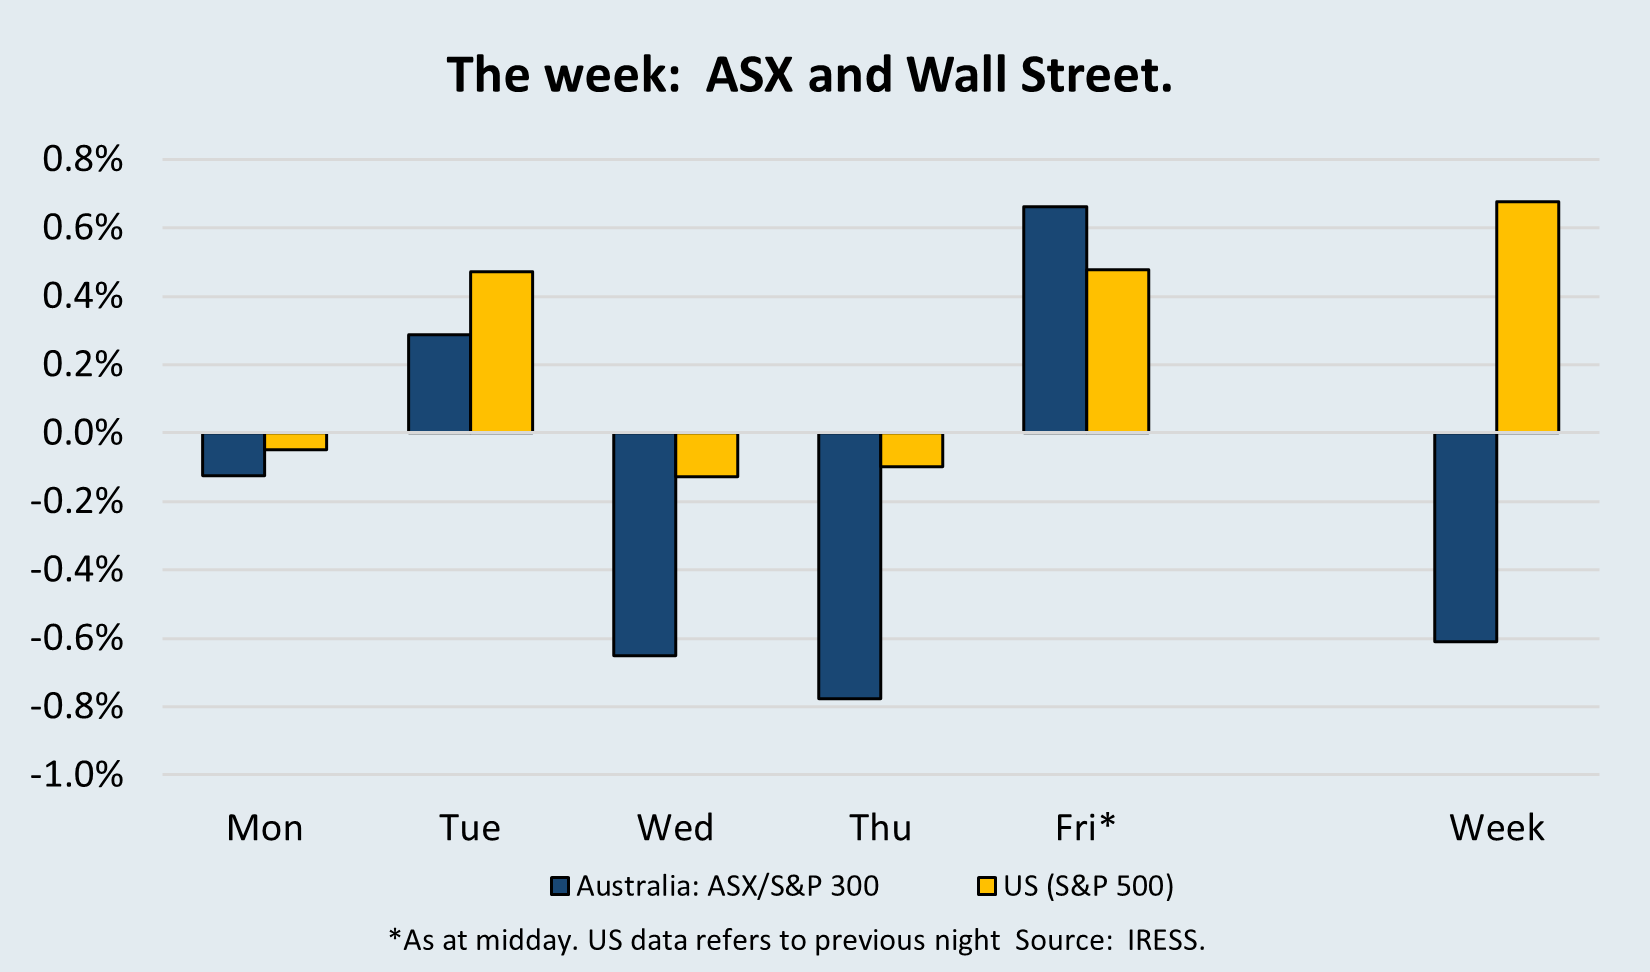
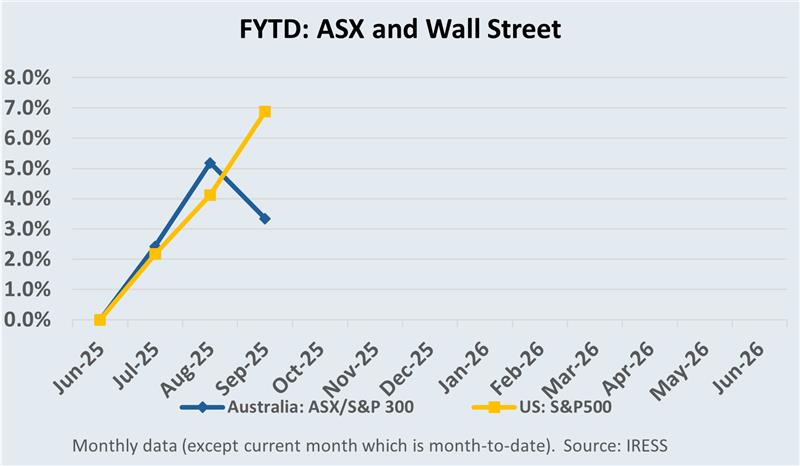
The first ten weeks of the 2025 financial year have been characterised by robust equity markets, heightened corporate activity, and renewed confidence that the monetary policy cycle has turned. The ASX has gained 4.5%, including dividends, reflecting resilient earnings and easing macro headwinds.
First Samuel clients’ portfolios outperformed the index over this period, with portfolio gains reinforced by strong individual stock contributions and timely positioning.
Reporting season injected its own brand of volatility, with results that beat expectations rewarded and those that disappointed heavily sold. This dispersion underscored the importance of stock-specific analysis: it was not enough simply to be exposed to the market; company execution and guidance made the difference.

Read the previous week’s Investment Matters.
The Market
First Ten Weeks of FY25
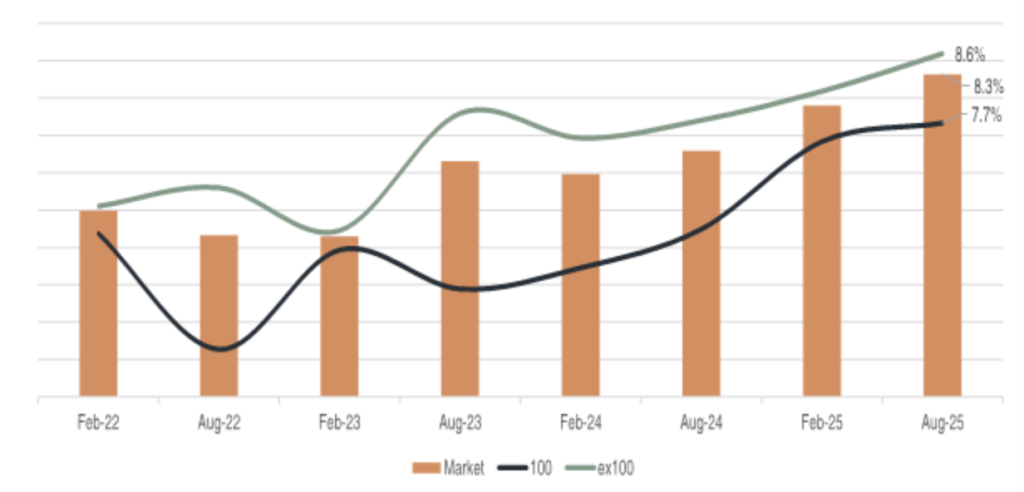
The chart below shows the level of share price volatility, each reporting period (February & August), around results for the market (Orange line), the largest 100 companies (Black) and the remainder of the ASX300 (Teal). The numbers in the chart indicate that, on average, companies’ share price moves 8.3% on announcement.
Figure #1: Volatility in company reporting season (February & August) continues to rise
Source: Barrenjoey Research
The overall volatility is heavily influenced by a smaller number of much larger movements, but the interesting trend for First Samuel as investors is the increasing trend of volatility across time since 2022. Increasing market sensitivity is said to be driven by the increasing influence of passive flows, algorithmic trading, and catalyst-driven strategies, which together are reshaping the landscape.
Combined with the drifting of share prices higher or lower following the announcement, there are increased opportunities for active investors, especially if the investor has a clear view of the underlying value of the company.
Market dynamics have also been important, especially in the short-term, with companies that have demonstrable momentum in each of share price, earnings expectations and operational clarity being rewarded heavily.
Within client portfolios, several companies demonstrated precisely the kind of resilience and delivery that investors rewarded.
- Life360 extended its growth story, with rising paid user numbers and a growing subscription base supporting operating leverage.
- Lynas Rare Earths was buoyed by demand for critical minerals and operational progress at Kalgoorlie, and development in the global outlook for rare earths supply.
- Origin Energy benefitted from higher wholesale electricity prices, combining this with a stable retail base to reinforce earnings visibility. Optionality in its Octopus Energy / Kraken investment only added to short-term upside.
- Seek has proved that even in a softer employment market, it retains a unique ability to monetise its market leadership in online job advertising.
- Collectively, these holdings provided a strong foundation for client outperformance. More recently, Emeco added to this list with a rally driven by takeover interest. nt’s guidance for FY25 is a “reset,” cleaning out the financials and establishing a new, more achievable base.
Interest rates
Globally, the investor focus remains firmly on interest rates. The U.S. Federal Reserve has now taken the first step towards easing, with Chair Jerome Powell announcing a 0.25% point cut in the federal funds rate this week. Markets took the move as confirmation that the tightening cycle has peaked, bond yields have moderated, and risk assets have responded positively. The RBA has already cut twice this year, including a 0.25% point cut in August.
The increasing influence of President Trump on the Federal Reserve, both directly, through appointments, and indirectly, from the bully pulpit, is beginning to have an impact. In the short term, this may lead to lower interest rates, but in the long term, the risks of losing central bank independence are not being fully priced by the market in our view.
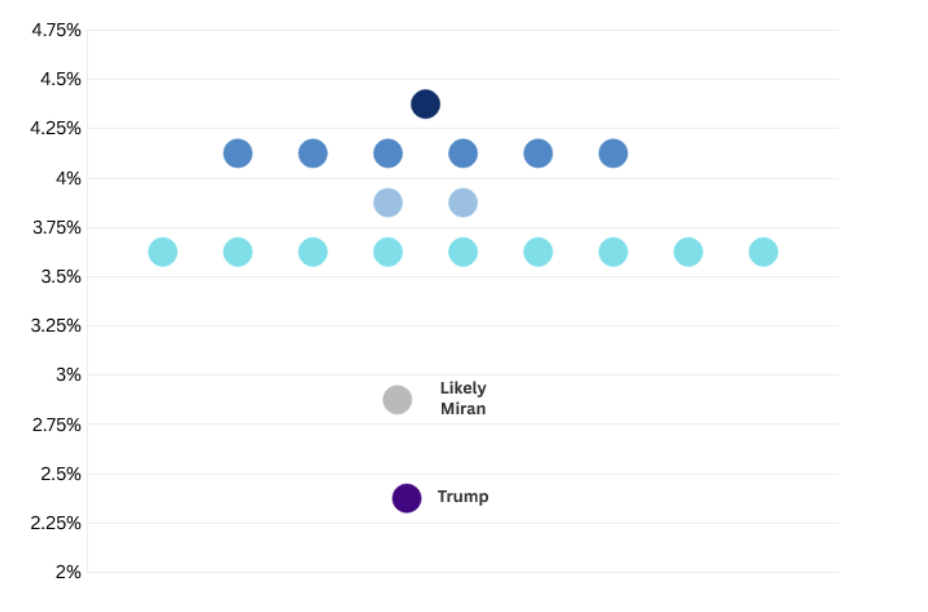
We contend that ultimately, the influence will heighten divergence within the Federal Reserve itself. In Australia, we rarely hear about the underlying tensions within the Reserve Bank board. Still, in the US the differences are expressed in the Fed “dot plot” which is a chart the U.S. Federal Reserve releases four times a year (with the Summary of Economic Projections) showing where each FOMC participant thinks the appropriate federal funds rate should be at the end of each of the next few years—and in the “longer run.”
See the figure below, each dot is one person’s view. Every participant places a dot at their preferred end-of-year policy rate for the specified horizon, 2025 in this case. Dots are anonymous. The following graph (cheekily) also adds President Trump’s state view and the likely view of Stephen Miran, a newly confirmed Governor.
Figure #2: September FOMC Dot Plot – plus Trump and Miran
Source: FOMC, CNBC
The chart shows that there was already significant disagreement regarding the future of rates in a mere 3 months’ time (from the midpoint of 3.5-3.75, in light blue, to 4.25-4.50 in dark blue), let alone before considering the influence of Trump.
We are continually reminded that in periods in history in which values and norms are continuously upended or challenged, societies find a way to resolve these tensions. But this process is rarely smooth and difficult to parse in the moment.
We remain concerned that US markets are relatively overpriced as they continue to consider the upside from AI and lower interest rates without adding a high enough discount for systemic change and sustained inflation. For this reason, client portfolios are tilted away from the most expensive US stocks, towards other parts of global markets which offer better value.
Small gold miners are sparkling
Clients may recall that FY-25 was the year to own gold companies in the ASX, with the general gold index rising more than 50%. Portfolio exposure to companies such as De Grey Mining and Catalyst Metals delivered amongst the highest returns in the portfolio last financial year.
With the takeover of De Grey and the sale of our position in Catalyst following a remarkable rise, we needed to replenish our gold exposure and add to our position in the globally significant Newmont Mining (USD86bn), listed on both the ASX and NYSE, and the only gold producer listed in the S&P 500 Index. We also have exposure to the gold price through Aurelia Metals, indirectly through Sandfire and our Small Cap index exposure (ISO). In fact, around 17% of the Small Cap Index is exposed to the gold price, so our index exposure is an effective way of capturing additional gold exposure in the myriad of smaller gold mining companies.
Clients have also gained exposure this year to a selection of two relatively new, smaller gold companies – Ora Banda Mining (OBM) and Minerals 260 (MI6) – both of which provide diversification and measured growth optionality. The actual client position will reflect individual risk preferences.
It has been a great start to FY26 for both companies, with OBM share price rallying 33%, and MI6, the recently relisted (April 2025) miner, rising 50%.
Ora Banda Mining (OBM)
Ora Banda has been repositioned as a leaner, more focused Western Australian producer centred on Davyhurst, with a program aimed at stabilising output and unit costs. OBM has tenements covering the region located ~120km to the NW of Kalgoorlie. The area has a long history of mining, with the first gold production in 1897 and ~1.7Moz produced at differing scales and times.
Ora Banda’s fortunes began to turn in recent years, driven by the combination of an improving gold price and the appointment of Luke Creagh as CEO in July 2022. OBM has pivoted the business toward underground mining, leveraging the region’s geology and the company’s commitment to an extensive drilling (exploration) program.
The figure below shows the dramatic increase in planned drilling (metres) over recent years
Figure #3: Ora Banda exploration program – metres drilled by year
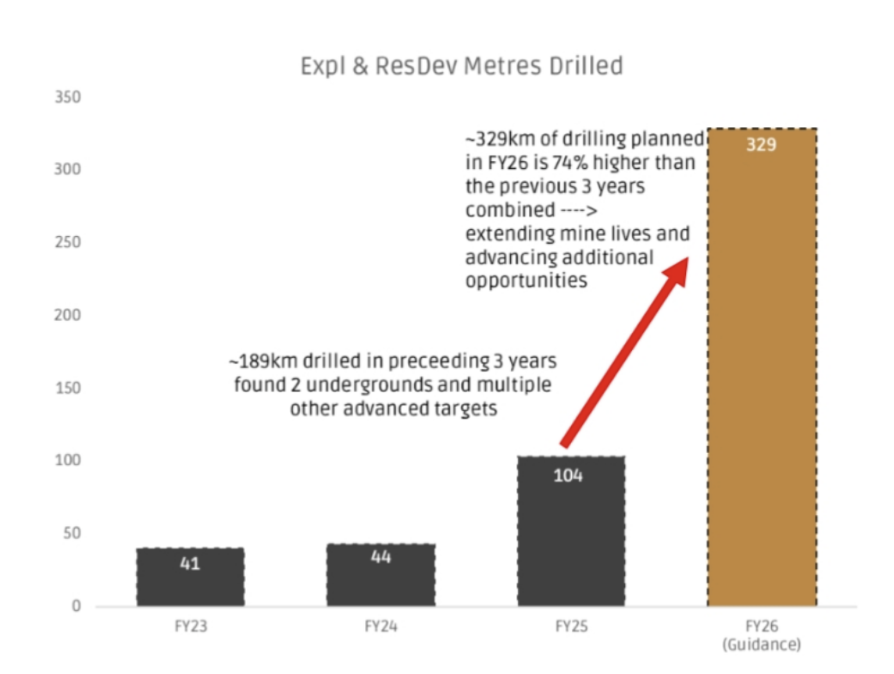
Source: OBM company presentations
By extending mine life through targeted drilling across its broader land package and exploiting operational improvement in grade control and plant reliability, the company provided the sort of self-help optionality that we look for in our gold miner position. This is a very similar strategy to the one used at Catalyst in previous years.
Minerals 260 (MI6).
Minerals 260 completed the acquisition of the Bullabulling Gold Project near Kalgoorlie in April 2025, consolidating a 2.3Moz resource base and resetting the company around a clear development pathway. The acquisition and multi-year work program were funded via a $220m equity raise at $0.12 per share, positioning the balance sheet to advance drilling, studies and approvals.
First Samuel took part in the equity raise in April with a small position for a range of clients with higher risk tolerances.
A ~80,000m drill program is underway, with early assays (including 22m @ 3.25 g/t Au) supporting continuity and potential resource growth at depth and along strike. Company guidance indicates studies targeting a final investment decision next year and potential first production in 2028, subject to outcomes and approvals.
Figure #4: Drilling at Bullabulling
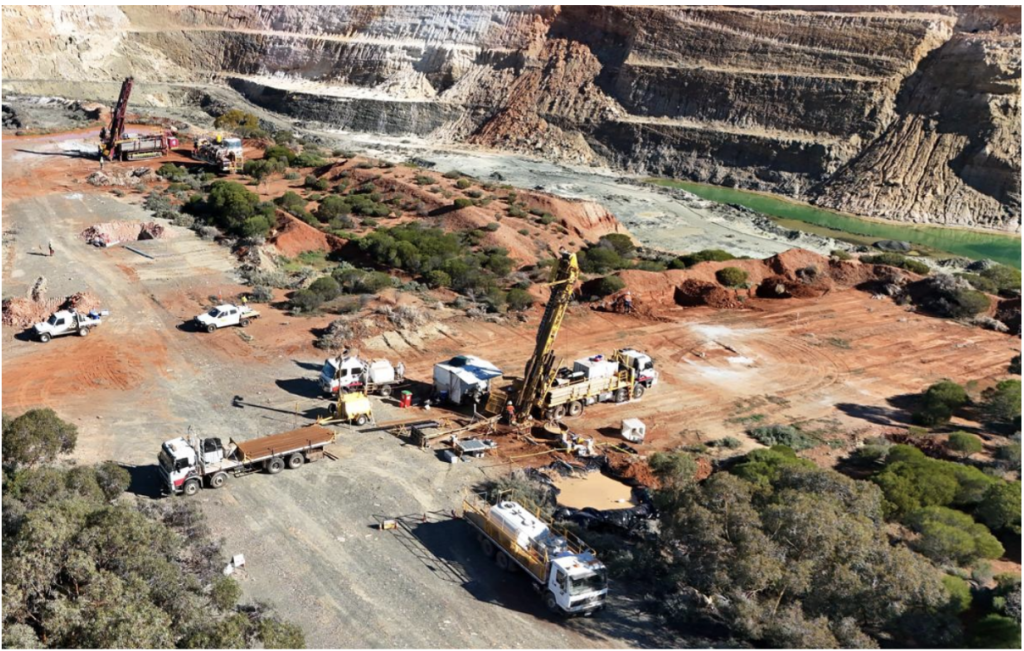
Source: MI6 Denver Gold Conference Presentation
The reaction to recent drilling results has been encouraging. Analyst descriptions of the upside in MI6 have been equally boisterous, with one (Ross Bennett, Morgans) calling out a resource update to be 3Moz+ and lifting his price target from 35c to 38c. At Barrenjoey Research, they expect Bullabulling will “present as an eminently financeable project and we see a path to equity re-rating as it moves towards a Final Investment Decision (FID) over the next 18 months”, with a price target of 30c per share.
Following the recent 50 per cent rally in the share price, we look forward to additional drilling results and finalised plans for development and production in 2026.
Santos (STO) – Takeover News
The headline event this week was the collapse of Abu Dhabi National Oil Co’s $36 billion takeover proposal for Santos. ADNOC’s foreign investment arm, XRG, had been leading a consortium to acquire Australia’s second-largest oil and gas producer. Due diligence was nearly complete, but just two days before the binding deadline, XRG announced it would withdraw its indicative offer.
Market commentary suggests several factors may have contributed to the withdrawal: challenges in securing Foreign Investment Review Board concessions, complexities in forming compliant Australian partnerships, and possible requirements to relinquish operatorship on sensitive domestic projects. East coast gas security concerns would likely have been a flashpoint during FIRB approval, adding to the uncertainty.
We first purchased our position in Santos at around $6 per share, conscious that the market had missed some of the long-term value of its assets. The XRG bid had placed a spotlight on the company’s portfolio, and in doing so drew market attention to the scarcity value of its infrastructure and reserves.
While the formal process is now over, Santos’ August results confirmed that the underlying business remains in strong health. Earnings were robust, capital management was disciplined, and the flagship Barossa project – a key offshore development – is now operational. The combination of solid results and the legacy of takeover interest means that while investors may be disappointed that no transaction eventuated, the company exits the process stronger, with its asset base more fully recognised and appreciated by the market.
Despite the failed deal, Santos has continued to deliver significant operational progress. The $2.4bn Barossa LNG project is more than 90% complete and nearing first gas. The Pikka project in Alaska has been accelerated, now targeting first oil in 1Q26. Together, these and other developments are expected to lift group production by 30% by FY27. Additional growth options remain, with Beach Energy signalling interest in Santos’ Narrabri and WA offshore assets.
Net-net, Santos retains a high-quality global LNG portfolio that remains attractive to strategic investors.
| Santos timeline | Share Price |
| First Samuel acquisition price | $6.00 |
| Underlying valuation (internal) | $7.85 |
| Price before XRG Consortium bid | $6.70 |
| 16th June: XRG Consortium effective bid | $8.83 |
| 16th June share price trades up to | $7.72 |
| Trimmed one-third of the position | $7.70 |
| 18 Sept: Price prior to bid removal | $7.96 |
| 18 Sept (Thu): Post-announcement close | $6.74 |
The withdrawal marks the third time a bidder has walked away from Santos in recent years. It has reignited pressure on management to lift shareholder value, but also reinforced the long-term attractiveness of Santos’ LNG export positions in Australia and Papua New Guinea, and its domestic gas exposure.
Emeco (EHL) – Takeover News
By contrast, Emeco has been a beneficiary of takeover speculation. The mining services company rallied strongly after confirming it had received approaches from potential suitors. In a statement to the ASX, the company noted:
“Emeco notes the speculation appearing in The Australian newspaper that it may be in discussions relating to a potential control proposal for Emeco. Emeco confirms that it has received unsolicited interest from a number of potential acquirers and has had discussions with those parties. However, at this time, no party has put forward a proposal which warrants being progressed to a binding proposal. Emeco will keep shareholders informed of any material developments as appropriate.”
While no binding offer has been tabled, the unsolicited interest highlights the latent value within the business.
The news of the approaches saw the share price rise 10 per cent, adding to gains since June 2025, which now extend to +45 per cent. For the first time in a number of years, Emeco is trading close to its Net tangible asset value (NTA)
As we noted in our 29 August Investment Matters, a capital equipment hire company trades at or above its Net Tangible Assets (NTA) when it demonstrates the right operational discipline: acquiring the right assets at the right price, maintaining and repairing them efficiently, pricing contracts to reflect lifecycle costs, and collecting revenues reliably. For equity holders, accurate accounts and transparent reporting of asset value are also essential.
When those conditions are met and demand is strong, there are a few reasons why a company should persistently trade below NTA. Historically, Emeco has at times suffered discounts due to weaker demand, higher debt, or questions around the sustainability of asset values. Today, none of those factors apply. We argued that there were no limits to the stock trading at or above its NTA of at least $1.30 per share, if not higher.
The unsolicited approaches confirm that others in the market recognise the same underlying value. Consolidation in mining services has long been anticipated, and Emeco’s fleet, earnings leverage, and balance sheet flexibility make it an obvious candidate. The stock’s sharp move upward on the back of this speculation has added materially to client portfolio gains
Our approach to investing, which focuses on underlying asset value, is designed to capture investments that are the target of either a direct takeover or are otherwise M&A beneficiaries.
The information in this article is of a general nature and does not take into consideration your personal objectives, financial situation or needs. Before acting on any of this information, you should consider whether it is appropriate for your personal circumstances and seek personal financial advice.