
Copyright 2025 First Samuel Limited
During reporting season, Investment Matters will update clients on all the results for portfolio companies in a simple table that outlines the share price impact of the results, along with short notes on our views of the results.
Readers should expect to see occasions in which we believe the result was positive, yet the share market reaction was the opposite, and vice versa. Such mismatches are often due to the difference in investment timeframes. We are assessing company results with a medium-term valuation perspective.
In the remainder of the document, we will provide more details on the larger portfolios’ positions and results of significance for our long-term valuations. When companies such as Cleanaway report late in the week, the longer description of the results will be retained for the following week. Occasionally, commentary on small positions in smaller companies will be retained until after the reporting season in September.
Read the previous week’s Investment Matters.
The Market
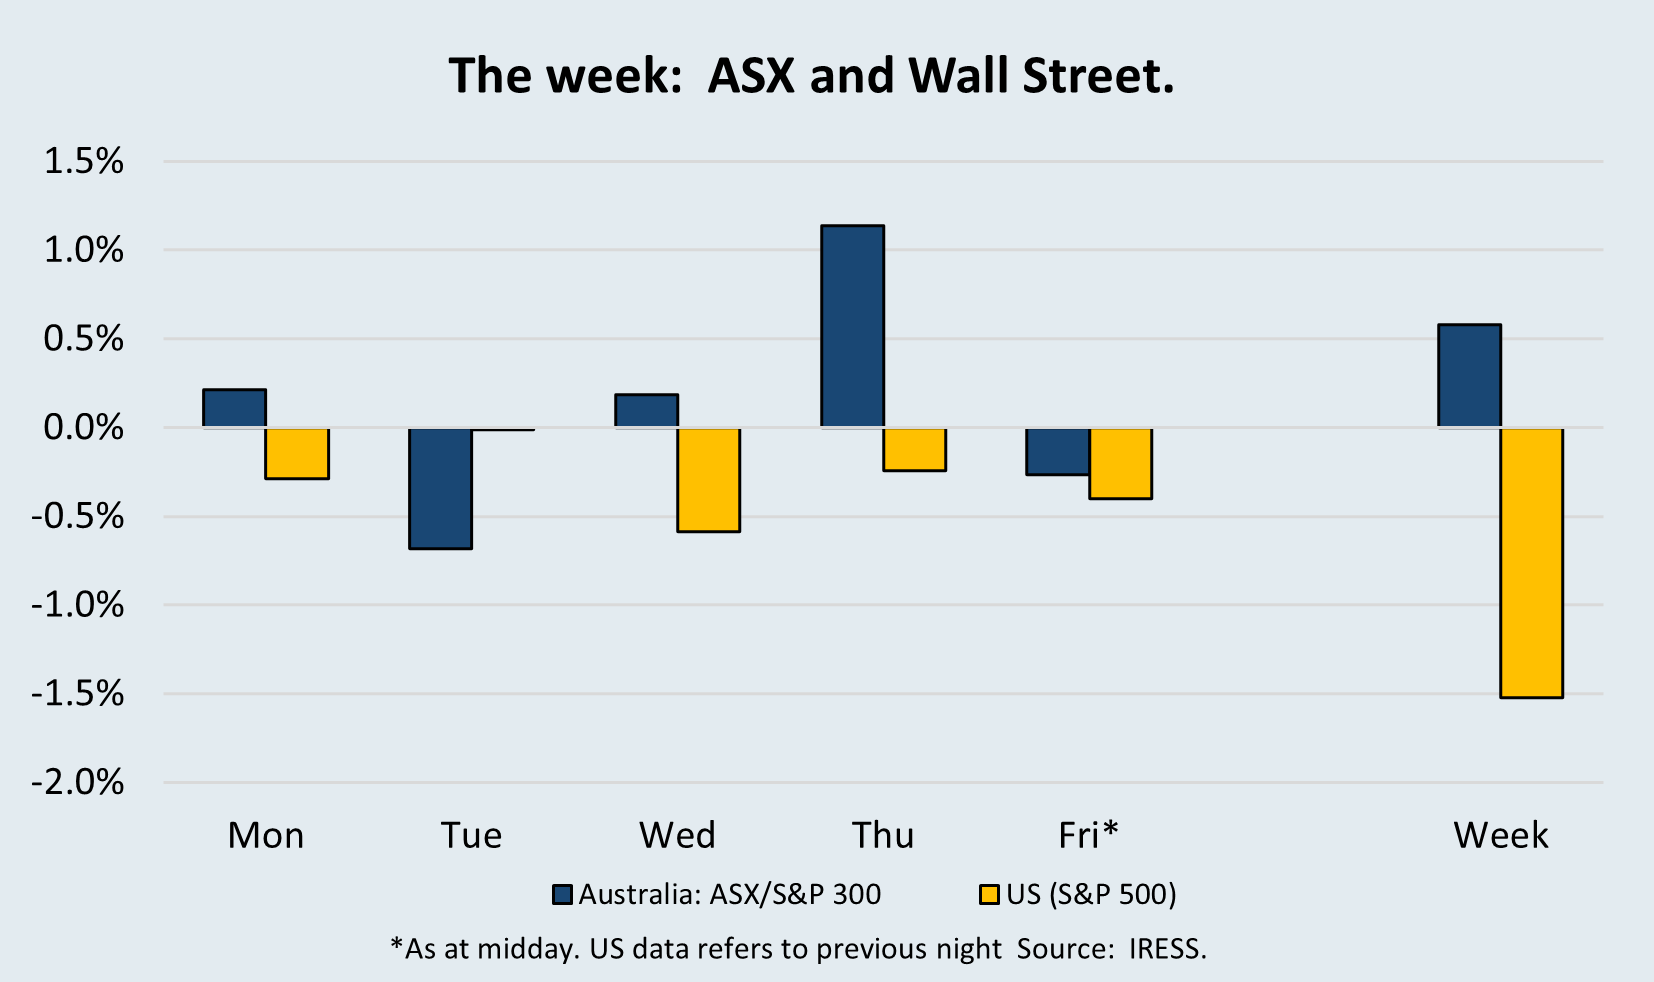
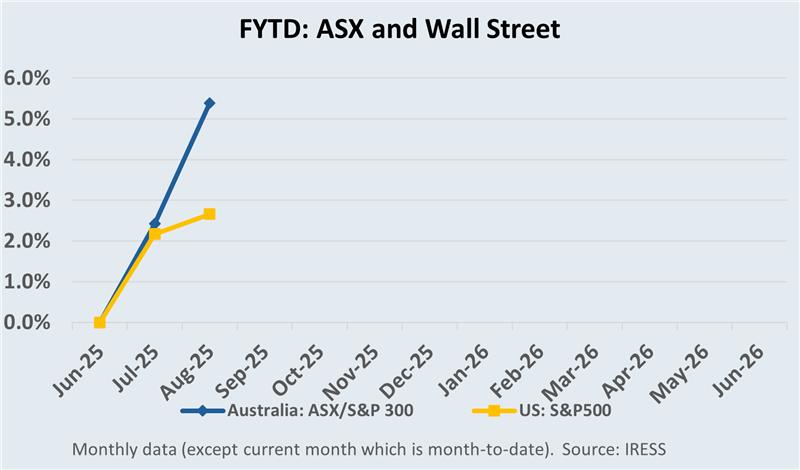
Table 1: This week’s reporting season result snapshot
| Company | Update | Impact |
| CSL Limited (CSL) | FY-25 Result | Mixed/negative: A dramatic series of announcements by one of the largest companies on the market rocked the share price this week, after a month of strong price growth. Demerging a giant vaccine business, owning up to a weak product pipeline and disappointment in core volume growth and margin expansion all increased uncertainty. Our view is that despite the sharp price decline, the long-term value of CSL increased this week. |
| -17% | ||
| Origin Energy (ORG) | FY-25 Result | Positive: Origin Energy met expectations and outlined an FY-26 that delivers dependable earnings and invests capital in Origin Energy’s superior network position. Since the result last Friday, the market has developed a clearer view of the value of core Electricity assets. Our valuation rose slightly, and the long-term value of its assets continues to strengthen. |
| +10% | ||
| Emeco Holdings (EHL) | FY-25 Result | Positive: Best result in many years, earnings growth and margin expansion. Free cash flow was exceptional, and Return on Capital (ROC) metrics were excellent. Emeco continues to expect further growth in FY-26, continued strong free cash flow and ongoing deleveraging. EHL is the cheapest stock in our universe, and it conservatively generates a 14% free cash flow yield. Our valuation rose more than 10%. |
| 0% | ||
| Challenger (CGF) | FY-25 Result | Positive: Challenger met expectations with Return on Equity above its target for the second consecutive half. The combination of interest from strategic investors, focus on the positive impact of the APRA capital changes, and improving sales dynamics are all supportive of the current share price. The combination of earnings certainty and balance sheet flexibility saw our valuation rise 3-5%. |
| +6% | ||
| Reliance Worldwide (RWC) | FY-25 Result | Neutral / Negative: Reliance pointed to weak operating conditions in a number of markets, short-term difficulties navigating Trump tariffs and industry softness emerging in the key US Markets. RWC Management style tends to accentuate the short-term concerns, which provides the market with additional uncertainty. We, however, saw a few long-term difficulties, and no negative impact on our long-run valuation. We remain attracted to the high-quality assets, demonstrable value creation from acquisitions and market-leading brand names. As US conditions improve and tariff pricing is resolved, we see significant upside from current levels. |
| -8% | ||
| BlueScope Steel (BSL) | FY-25 Result | Mixed: Pockets of weakness were isolated, and the rebound expected in earnings in FY26 is supportive of current price levels. The long-term value of its premier US steelmaking assets continues to rise in a world where tariffs are again the norm. Execution risks in the downstream product businesses remain, and weakness in current conditions in the US and Australia is problematic for short-term investors. We continue to see long-term value. |
| -1% | ||
| Stockland (SGP) – Property Sub-portfolio | FY-25 Result | Positive: Stellar FY-25 outcome, profit soaring to A$826 million driven by substantial lot settlements, master-planned community volume growth, elevated development fees, and an uplift from property revaluations. SGP reaffirmed a 25.2 cps distribution, supported by surging residential demand, strategic logistics and data centre ventures. The alert to future data centre earnings excited the market. Stockland remains a profitable long-held position, |
| +10% | ||
| Seek Limited (SEK) | FY-25 Result | Positive: A highlight of the reporting season, Seek Limited delivered a strong performance in weak economic conditions. Simultaneously, the company demonstrated that previous investment is being rewarded, and that future possible returns are higher than previously anticipated. Seek was one of the few companies that highlighted the upside of AI on its operations. |
| +12% | ||
| Cleanaway (CWY) | FY-25 Result | Neutral: The result met expectations, and the outlook was consistent with medium-term growth aspirations. Operationally, Cleanaway always appears more difficult than the asset’s quality would otherwise dictate. We appreciated the continued improvement in Return on Assets and remain attracted to the strategic value of its portfolio. |
| -1% | ||
| Mirvac Group (MGR) – Property Sub-portfolio | FY-25 Result | Mixed: Key positives with the result included signs of construction cost pressures easing in NSW/VIC. Unlike Stockland, the company slightly missed expectations. Medium-term upside remains in Mirvac should today provide the start of a multi-year recovery in earnings for MGR as residential and office operating conditions and execution improve. |
| +4% | ||
| HMC Capital (HMC) – Property Sub-portfolio | FY-25 Results | Mixed: With the stock whipsawing between $4 and $12 per share over the past year, it is fair to say that the market is hypersensitive to very short-term issues. Volatility continued this week following lumpy profits and short-term uncertainty. From our perspective, the medium-term outlook remains much stronger than current expectations, and remains a core position in the Property sub-portfolio. |
| +10% | ||
| Lendlease (LLC) – Property Sub-portfolio | FY-25 Results | Positive: Turnaround in profits in FY-25. Prior years’ capital recycling is driving earnings, and cost savings exceeded targets. Both profit and fully franked distributions rose. Lendlease’s pipeline is also improving. Although not a successful investment as yet, a core reason we hold this position is the prospect of a turnaround, along with the chance of a breakup and takeover. This week, the Lendlease CEO, Tony Lombardo, launched a robust defence of its $10 billion property funds business that rival Mirvac appears to be angling to take over. |
| +3% |
The price change % is the movement from the time of results release to EOD on Thursday, 21/08.
This week, we present detailed result commentary for CSL, Origin Energy, Seek Limited, BlueScope Steel and Judo Capital.
A more detailed summary will be available for Emeco Holdings, Cleanaway, Reliance Worldwide and Challenger in next week’s Investment Matters. Smaller positions, and those in the Property sub-portfolio will be reviewed in detail following the reporting season in September.
CSL Limited (CSL): Stunning response to market update
CSL’s stunning fall was the most significant movement during this reporting season so far. Despite announcing profit SL’s stunning fall was the most significant movement during this reporting season so far. Despite announcing profit growth, a further buyback and higher profits (up 14% to US$3.3bn), CSL’s shares plunged by 16.9%, marking their worst single-day drop, wiping out about A$21bn in market capitalisation.
For clients, CSL is a smaller than market-weight position (which is more than 4.2% of ASX200). We recently bought back into CSL around the $245 per share level. Following a quick rebound in the share price to $275, more than $50 was wiped off this week.
What drove the impact?
- Lower growth in the core Behring blood plasma business
- Disappointment with the evolution of gross margins in blood – this has been an almost singular focus of the market in recent years.
- Growth concerns in a range of secondary products – a concern that lay under the surface for several years.
- The announcement of the demerger of Seqirus (vaccine) assets, and finally
- The outline of a significant increase in investment is required.
We would note that while the Seqirus demerger and restructuring are designed to sharpen long-term strategy, the sheer scale and execution risk created uncertainty that unsettled investors.
As a reminder, the company has three divisions: 1) CSL Behring (plasma-derived products, recombinant proteins and other innovative therapies); 2) CSL Seqirus (vaccines); and 3) CSL Vifor (iron deficiency, nephrology and cardiorenal products).
Our view
Somewhat perversely, our valuation of CSL is higher following the announcement. We noted in the introduction to this and last week’s Investment Matters that such an outcome is possible where the share price is viciously negative, yet our long-term valuation rises or vice-versa. The reason is the short-termism of the market.
We would argue that a CSL management team that
- comes clean on the weakness in their new product pipeline
- commits to refocused investment in new products and invocation
- splits the company into a higher growth plasma and kidney business, apart from a constrained and potentially problematic vaccine business
- utilises new technology and investment to reduce headcount
has improved the business, and indeed this was the driver of the upgrade in our valuation.
The market, however, saw short-term risks, additional investment as a drain on future stock buybacks and upside that is too far into the future. Our view is that CSL is prioritising operational clarity and efficiency, betting that a leaner structure will yield better performance and valuation over time.
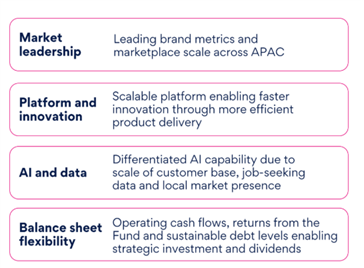
Figure 1: Overview of CSL plans for reinvestment
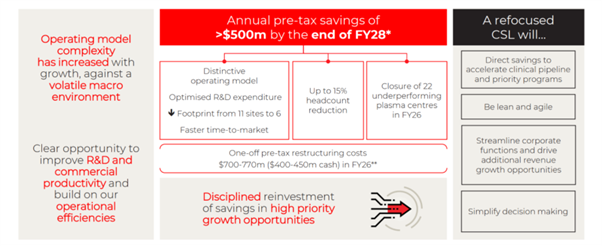
Source: CSL company reports
The figure above highlights the commitment by the management team and board to recapturing the innovation-led investment that built CSL into a great company over the past 50 years. Instead of simply relying on the fabulous economics of blood collection and fractionalisation of product, CSL will return to a business that is wisely investing current earnings into new opportunities.
There remains a great deal of uncertainty in the short term. The market will need additional information regarding the demerger, its timetable and associated costs. The market will need new information on the investment plans, and more clarity on areas of the CSL business where results disappointed, and products and subsidiaries had weaker revenue.
As long-term investors, we are pleased with our entry price for a company that is such a large share of the ASX300 index. We appreciate the history of demergers on the ASX, which often provides opportunities for investors to hold positions through the demerger process profitably.
The outlook for growth in its core already justifies the current CSL share price. With the possibility of additional upside from research and development, CSL looks for the first time in many years to justify a solid if unspectacular core position in client portfolios.
In an environment in which 30-40% of the ASX200 index by capitalisation is overpriced, the setback in the CSL price should prove positive development for long-term portfolio returns.

Judo Capital (JDO): Tracking to higher profits
Judo has carved out a credible niche in a highly competitive banking sector characterised by the incumbency of the majors. Judo’s ambitions to scale are likely to be supported by structural drivers within the broader business banking market.
In meetings with the senior management this week in our offices, we were impressed by the focus on developing a great team of business bankers as the key to success. We expected that when supported by great systems, the ultimate success of Judo would come down to the ability of the 200+ bankers and analysts to connect with Australian business and add value to their clients. If they can do this, they should be better placed to provide a better product than the Big 4, which remain under-resourced and more interested in home loans.
Our conservative forecasts suggest that Judo’s lending book could double in the next 4-5 years, driving significant operational efficiencies, materially growing earnings and putting Judo in a position to generate substantial internal capital that can continue to drive investment in growth.
As the bank is still in the growth phase, the market and its sector analysts are concentrating on four critical metrics.
- What is the underlying profit margin of the loan that Judo is writing – i.e. what is the difference between the amount they charge for the loans, and the cost of securing funding? This is referred to as the NIM or Net Interest Margin. The run rate for NIM was pleasing, implying that at scale, Judo would be generating a strong return on capital
- What is the growth rate in new lending, that is, when will the bank achieve sufficient scale to offset its margin costs, fractionalise its overheads and begin to generate economic profits? The growth rate in lending met market expectations.
- What is the trajectory for costs? Is the increase in scale of the bank leading to lower costs as a percentage of income, and is this trajectory consistent with the level of costs that, when the business is at scale, will generate sustainable economic profits? The cost trajectory was acceptable, not stellar.
- Are the loans that Judo is writing good-quality loans? For instance, what is the level of bad debts? How many loans are behind in their payments? Are they spread across industries or concentrated? The underlying question is whether the system processes and, more importantly, people in Judo are capable of lending money profitably. After all, anyone can lend money out; the trick is getting it back often enough. Loan performance was OK. Figure 2 below shows the percentage of the loan book that is either impaired or 90 days past due (DPD).
Figure 2: Judo 90+ Days past due (DPD) and Impaired Assets as % of GLA
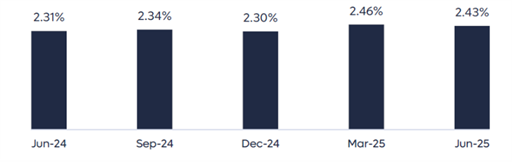
Source: Company reports
So, with the bank on a trajectory to profitability, and the outcome far from guaranteed, given the size of the competitors (the behemoth four big banks), an investment in Judo needs to account for two key issues in our minds
- Does the position size reflect the risk of outcomes in which Judo fails to achieve scale and profitability within a reasonable forecast horizon?
- Is the current price of the stock either too pessimistic about its chances of success or too bullish about the same?
The answer to the first is that Judo remains a relatively small position (less than 2% in client accounts), and the answer to the second is clear in the manner in which we have traded client positions. Judo Bank listed on the ASX on 3 November 2021, with an initial public offering (IPO) price of $2.10, valuing the company at $2.3bn.
We believe that at the time, this fully valued the future success of the business, as if it had already happened!! However, when the share price traded lower than $1.00 per share in late 2023 and early 2024, we felt the discount was too high.
When the stock traded up towards $2.00 in late 2024, and valuation support was limited (our valuation was circa $2.10 per share), we trimmed the position. When the stock sold off again in 2025, we added to our position—having a firm commitment to a base valuation allowed for successful trading in Judo.
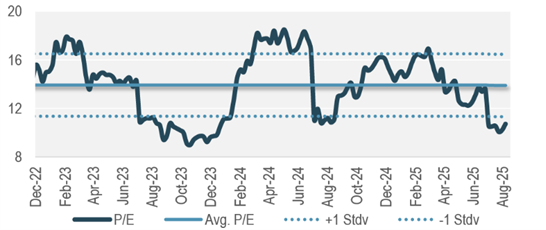
The swing in exuberance for the company’s future is illustrated well in the following chart, which is the 2-year forward PE. Unlike a trailing PE ratio, this measure includes an element of the growth the company is expected to achieve in two years. The multiple paid since December 2022 has varied between less than 10x in October 2023 when we set out our position and more than 18 times in late 2024 and early 2025 when we trimmed our position.
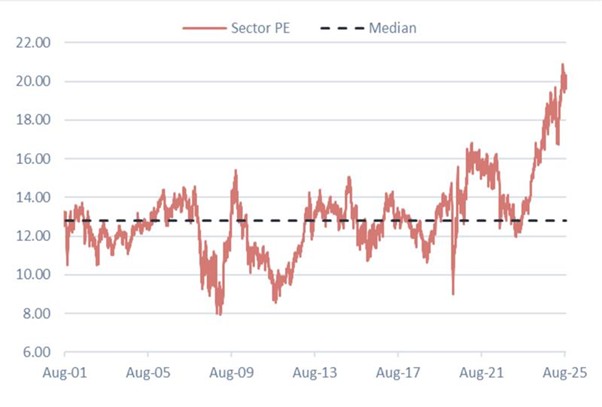
For context, we can compare the forward PE of Judo, which is now less than 12x, with the PE of the major banks (Figure 3 below), which has risen to more than 20x earnings. So, despite the lack of growth in the Big Four banks, Judo is now trading at a significant discount to them with vastly higher growth and the inherent benefits of being able to build a new business without the constraints of the past. ly higher growth and the inherent benefits of being able to build a new business without the constraints of the past.
Figure 3: JDO – 2-year Forward P/E ratio since listing
Source: Barrenjoey Research
Figure 4: ASX Banking Sector Forward PE since 2000
Source: Jarden Research
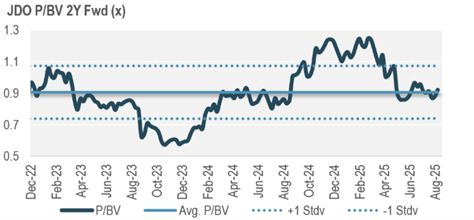
Another way in which to benchmark the value of a bank is to look forward and forecast the value of its balance sheet, its so-called Book Value. Banks can then be valued as a multiple or discount to their Book Value depending on profitability, market structure, the source of their funding and capital returns. A feature that appeals to us in the Judo share price is that we are only paying a discount to the two-year forward book value (Figure 5 below). This compares to huge premiums to book value commanded by such companies as the Commonwealth Bank.
Figure 5: JDO Price to Book Value
Source: Barrenjoey Research
We will remain disciplined with our Judo position, and given our valuation was unchanged following the results, we are unlikely to invest a significant level of new money into the stock. We will be attuned, however, to occasions when the stock trades at a heavy discount, or when it no longer appropriately discounts the uncertain future outcome.
Seek Limited (SEK): The year of vindication
Seek FY-25 Result – Operational Leverage Emerging
The title of this section was originally coined in a Macquarie analyst note. Ordinarily, we avoid adopting broker phrasing, but in this case, it encapsulated perfectly the market sentiment following Seek’s FY-25 result. The reaction was immediate: Seek’s share price rose more than 12% on the day of the announcement.
Figure 6: SEK – Delivering against strategic objectives is continuing
Source: Seek FY25 Results Presentation
Our Investment Thesis
When we first built a position in Seek several years ago, our view was that the company possessed hidden capacity for operational leverage.
We believed that Seek could grow revenue even during softer periods for job ads, and that cost growth should not consistently outpace revenue growth. With its outstanding assets and strong market position, we expected better management to translate higher revenues into disproportionately higher profits.
That was the implicit promise when former CBA CEO Ian Narev took over as Managing Director in 2019.
FY-25 – Delivering on the Promise
FY-25 delivered on that thesis. Seek reported higher revenue despite lower job ad volumes and lower expenses despite inflationary pressures.
This is clear evidence of operating leverage. It also provides confidence that when job ad volumes recover and macro conditions improve, Seek’s profit trajectory could accelerate materially.
Project Unification – From Cost Centre to Value Driver
A key element of the result was the tangible progress from Project Unification, the technology transformation that has dominated investment in recent years.
Historically, management pointed to this program as the reason operating leverage had been delayed. In FY-25, we saw the benefits:
- Capital expenditure declined as projects were completed.
- Importantly, the programme appears to have reduced the cost of future development—a rare outcome given many corporate transformation projects simply continue under new banners
This shift supports a leaner cost base and provides confidence in sustainable margin improvement.
Financial Results & Outlook
Seek delivered Cash NPAT of $280m, up 18% year-on-year, with EBITDA of $520m and EPS of 78cps. Revenue grew despite lower ad volumes, while operating expenses fell in real terms. Looking ahead, management guided to mid-teens profit growth in FY26, supported by disciplined costs, stabilising job markets, and benefits from Project Unification.
Outlook and Valuation
With falling interest rates, strong population growth, and signs of renewed business formation, conditions are aligning for Seek to expand profits materially over the next three to five years.
Our valuation has increased by more than $2 per share, and at current prices, the stock retains significant upside if internal improvements continue to deliver.
In our view, FY25 represents an inflection point: Seek is now demonstrating the operational leverage we anticipated, underpinned by disciplined cost management and technology-driven efficiencies.
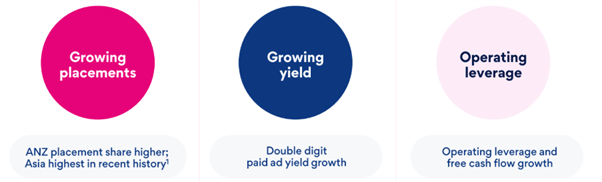
Within this context, Seek’s outline of future growth foundations, shown in the figure below, now appears more viable.
Figure 7: SEK – Growth foundation now more valuable given operational leverage
Source: Seek FY25 Results Presentation
BlueScope Steel (BSL): Medium-term growth projects still intact
Slightly lower than expectations, BlueScope Steel experienced a profit fall of 40%, with FY-25 Underlying NPAT (Net Profit After Tax) of A$420.8m, down from A$805.7m in FY-24.
Segment-wise, earnings across North America, the region owning the most valuable assets, were hit hard: underlying operating earnings dropped 45% to A$514.4m, driven by lower selling prices and operational challenges. Despite the financial setback, BlueScope maintained its final dividend at 30 cents per share.
The confidence in keeping the dividend was based on the company’s confidence shared with First Samuel regarding its profit expectations in FY-26. The company projected first-half FY-26 underlying EBIT between A$550m and A$620m—well above the prior year’s H1 result (~A$309m). The 1H FY-26 run rate is consistent with full-year expectations.
Coated Products
North Star
Accountants and auditors prompted an A$438.9m impairment charge tied to its North America coated products business, acquired in 2022. That segment, alongside others, struggled amid lower volumes and challenging operating dynamics, and it faced some ongoing challenges caused by Trump’s tariffs. We believe that the long-term value of the coated products business and its downstream distribution is underestimated in the medium term.
The flipside of the impact of tariffs on the coated product business is the positive impact that tariffs will have in FY-26 on the North Star. North Star remained one of BlueScope’s strongest assets in FY-25, continuing to operate at the lower end of the US steel cost curve. Management reaffirmed its role as the “engine room” of US profitability, and it remains the key to our investment thesis.
Consistent with our investment style, we appreciated the Ohio mill’s cash generation.
Both politics and recent investment are rewarding North Star. The plant benefited from recent capacity expansions and debottlenecking investments, which lifted throughput and efficiency. Production volumes held firm even as US steel prices softened, demonstrating North Star’s reliability. Its scale and efficiency continue to underpin BlueScope’s competitive positioning in the US market.
North Star’s contribution in FY-26 will likely exceed current market expectations. North Star is expected to maintain strong utilisation in FY-26, aided by a more favourable steel pricing environment forecast for H1. It will also be central to BlueScope’s push for sustainable steel solutions and its strategy to grow higher-margin downstream businesses in North America.
Short-term sensitivity
A core characteristic of this year’s reporting season has been the sensitivity of the market to short-term economic conditions and earnings expectations. So, despite a strong rebound in earnings expected in FY-26, the share price fell. This was disappointing, considering the source of the slight miss in earnings was entirely due to a small business in New Zealand that has limited value in the overall scope of the company.
Continued investment in growth initiatives
Investments that form the base of our Australian Equity sub-portfolio tend to combine significant assets with growth options and a consistent outlook for cash flow. In the case of BlueScope Steel, the metrics for growth and reinvestment are clear.
The figure below outlines the range of growth initiatives and size of the prize in EBIT terms. Should these objectives be met, our valuation would rise considerably.
Figure 8: BSL – Growth initiatives remain at the core of our portfolio position =
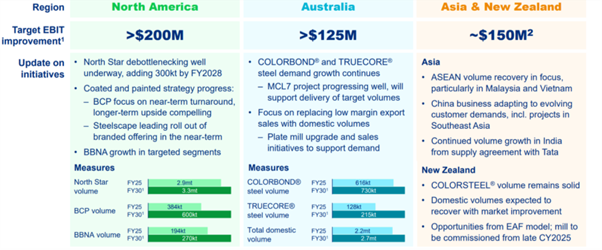
Source: BlueScope FY25 Results Presentation
Australasia and Whyalla
BlueScope delivered a resilient performance across its Australian operations in FY-25. Despite subdued global steel spreads and challenging energy conditions, the company posted underlying EBIT of A$261.6 million—a 31% decline from FY 2024. This was supported by higher domestic volumes, particularly in residential construction, and robust demand for COLORBOND® and TRUECORE® steel. Lower raw material costs helped offset weaker selling prices, though rising electricity expenses constrained margin expansion.
Making headlines was the commentary regarding the importance of securing a gas supply in Australia at reasonable prices. BlueScope’s CEO, Mark Vassella, issued a stark warning regarding unsustainably high energy costs, with domestic gas and electricity prices three to four times higher than in the U.S. despite our capacity to export.
Vassella dismissed the logic of importing LNG to make up for exports, calling it nonsensical.
This warning was a strong reminder that manufacturing in both Australia and the US is intrinsically political. Political support and national interest lie at the heart of our investment case.
Of interest to readers will be the discussions regarding a role for BlueScope in the bailout of the Whyalla Steel Plant. There are many good geopolitical and industry policy reasons to maintain the capacity to build steel within a country as far from the rest of the world as Australia. And doing so at a mill which sits next to a high-class iron ore mine may be even more valuable than other alternatives.
But equally, geopolitics doesn’t make a steel mill make money, and hence the ongoing problem faced by owners of this asset over the past 50 years.
In the results presentation, BlueScope noted that it is leading a consortium to review options for the Whyalla Steelworks and magnetite mine, with POSCO Nippon Steel and JSW. Some possibilities include using Whyalla as a prospective location for the future production of lower emissions iron (eg DRI) for both domestic and export markets. It could play a role in the decarbonisation of the global steelmaking industry
The trick for BlueScope will be securing the assets and any funding for the project at attractive prices, preferably with government assistance and support from JV partners. At this stage, we would not include any value in such an option, but how it develops over the next 12-18 months will be interesting for all involved.
Origin Energy (ORG): Clarity and privileged assets
Origin Energy’s share price has risen 20% since June 30th and is now approaching our valuation. The rise in share price has been driven by a mix of strong operating conditions, corporate interest in its UK investment in Octopus and Kraken, and increased appreciation of the quality of its assets.
We enjoyed hosting the senior management team at our offices this week, discussing the strategic value and future expectations they have for the markets they dominate. Origin has been a long-held, but often traded client portfolio position that continues to demonstrate three themes to the market
- Origin owns significant assets
- Australia’s leading integrated electricity “gentailer” – (generation and retailing)
- A 27.5% stake in APLNG (Australia Pacific LNG)– the largest producer of natural gas in Eastern Australia and a major exporter of liquefied natural gas to Asia
- An integrated domestic gas business
- An investment in the UK Octopus Energy, including the globally impressive Kraken, a technology platform developed by Octopus Energy, designed to manage all aspects of an energy supplier’s operations, from customer service to grid management.
- Origin is successfully balancing the task of maintaining both substantial dividends and ongoing investment in the energy transition
- Origin’s position in the National Electricity Market (NEM) continues to strengthen. We believe that Origin has a privileged position because of the unique mix of assets it controls and how those assets interact with NEM market rules.
- Origin owns and operates Eraring Power Station in NSW, its scale has given Origin flexibility to set or influence prices in peak periods, and remain central in the NSW plans to decarbonise its electricity generation
- Origin also owns a fleet of gas peakers, hydro, and growing battery projects, enabling it to arbitrage between production at different times. This flexibility was responsible for up to $100m of profits in FY-25
- Origin is both a generator and a retailer. This means it can hedge its wholesale price exposure internally
- NEM rules reward firms that can supply firm, dispatchable capacity. With rising renewables penetration, the value of flexible, dispatchable assets has increased. Origin is well-placed to capture volatility and price spikes caused by intermittent solar and wind generation, and finally
- Origin is always consulted in regulatory settings due to its systemic importance.
The impact of Origin’s privileged position generates strong gross margins in its Electricity segment. In FY25, the company exceeded its medium-term target range of 25 to $40 per MWh. If the wholesale margin is $40 per megawatt-hour (MWh), then the equivalent price in kilowatt-hours (kWh), which is the unit used for household electricity consumption, is $0.04 per kWh.
That’s right, Origin only makes 4 cents per kWh out of our electricity bill, and it still needs to pay the operating costs of running the company and providing the services and accounts we utilise. Origin Energy’s share price has risen 20% since June 30th and is now approaching our valuation. The rise in share price has been driven by a mix of strong operating conditions, corporate interest in its UK investment in Octopus and Kraken, and increased appreciation of the quality of its assets.
Figure 9: Origin (ORG) – Electricity gross margin since FY-21
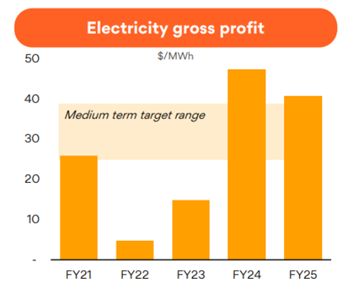
Source: Origin Y25 Results Presentation
Our view is that the medium-term target range likely slightly understates the capacity of Origin within the current structure of the National Electricity market, given the impact of transition, the closure of coal-fired power stations, and the type of assets Origin owns.
Financial result
Origin reported an underlying profit of A$1,490m for FY-25, up from A$1,183m in FY-24.
- Energy Markets delivered A$1,404m, ahead of guidance but down from FY-24 levels, hit by lower electricity and gas gross profit.
- Integrated Gas: Strong performance with A$2,202m, up A$251m year-on-year, thanks to high LNG trading gains
- Octopus Energy: Despite weak financial outcomes in FY-25, the FY-26 outlook is improving. Octopus is reportedly planning to demerge its tech arm, Kraken, to create a standalone entity which could be valued at £10bn on its own.
- Origin’s Balance sheet remains strong, and ROCE (Return on Capital Employed) is impressive at 14.6% overall.
- A final dividend of 30 cents per share (fully franked) was declared, bringing total FY-25 dividends to 60 cps (86% of adjusted free cash flow)
Trading and valuation
Origin Energy’s share price has historically been more volatile than its underlying value. This has allowed us to consistently trim our position when its price is too optimistic and add when market pessimism is at its peak. We anticipated that today’s trading range is approaching the too optimistic level.
We anticipated Origin Energy would remain a staple position in client portfolios as long as its strategically privileged assets remain well-managed.
The information in this article is of a general nature and does not take into consideration your personal objectives, financial situation or needs. Before acting on any of this information, you should consider whether it is appropriate for your personal circumstances and seek personal financial advice.