Copyright 2026 First Samuel Limited
Read the previous edition of Investment Matters.
The Market
Rising Macro Risks Behind the Headline Numbers
As noted in the AFR with tongue firmly in cheek, “It’s a miracle”, official figures confirmed on Monday that China’s economy grew at exactly 5% in 2025. Thus meeting the target set a year ago by the government, and confirming the initial estimate provided by President Xi Jinping on New Year’s Eve.
But beyond the scepticism of the headline dramatic issues lay below the surface.
China’s announcements this week of slowing GDP growth, very weak population growth, and a sharp fall in births reinforce a broader concern that macro risks in China are rising, not stabilising. While headline growth remains positive, the underlying composition of that growth is deteriorating. Debt is rising faster than income, domestic demand is weak, and the economy appears increasingly reliant on external surpluses rather than internal dynamism.

In this week’s Investment Matters, we outline how and why this underlying structural risk informs our portfolio choices going forward. To summarise we are looking to:
- avoid companies and products for which China represents the bulk of demand;
- avoiding business models that rely on ever expanding Chinese demand to support their valuations;
- as alternatives, we see investments in companies that own assets that would benefit from rising domestic production in Australia, and shorter global supply chains; and finally
- in our resources exposure we favour minerals such as copper and rare earths that have global demand growth rather than simply Chinese demand growth.
At face value, China’s reported growth rates still look respectable by developed-world standards. However, growth that is increasingly credit-intensive, state-directed, and export-dependent is unlikely to be self-sustaining. This matters not only for China, but for global capital allocation, commodity demand, and trade balances.
The risks are heightened by the return of competitive mercantilism worldwide. China was once allowed to pursue mercantilism without restraint. As noted by Eurasia Group founder Ian Bremmer this week.
“The Chinese were integrated into the global economy on the assumption that as they got wealthier and more powerful, they would become more politically and economically like us. They’d become, they’d reform politically more democratic, they would reform economically more supportive of free markets. The latter didn’t happen at all. Xi Jinping consolidated power. It’s still very much a dictatorship, and if anything, it’s more of a state capitalist country.”
The US is now pushing back on the Chinese export model with the reintroduction of global tariffs. Next to be affected are countries that become the new target of China’s aggressive trade model as products moves away from the US to their own developing markets. The chart below shows in 2025 China’s entire decline in trade surplus with the US has switched to ASEAN countries and the EU. In the face of their own hollowing out of domestic industry, early in their own development path for ASEAN countries and late in the case of the EU, both destinations may also need to recalibrate their relationships with China.
Figure #1: Trade balance rise again with a switch away from US
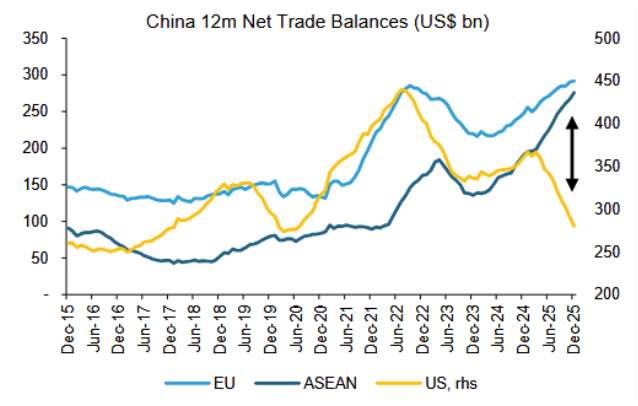
Source: Bloomberg, Macquarie Global Strategy
A Growing Trade Surplus Is a Sign of Weakness, Not Strength
China’s expanding trade surplus is often framed as evidence of competitiveness. In reality, for a large and diversified economy, it signals domestic weakness. This is especially the case after it moves up the income and wealth curve. Today, China’s ability to expand its trade so quickly is driven more by (a) domestic over production, evidenced by domestic deflation, and (b) its ability to flood other emerging markets with goods that are produced at prices far below the low run cost (after accounting) for the true price of capital, and the costs of environmental degradation.
Strong economies typically import more as incomes rise, consumption expands, and services deepen. China is doing the opposite. Weak household confidence, a damaged property sector, and limited social safety nets have suppressed consumption, forcing excess capacity to be exported.
Rather than reflecting strength, the trade surplus highlights:
- Insufficient domestic demand
- Excess industrial capacity
- A lack of profitable domestic investment opportunities
- China’s ability to dump excess production in other emerging markets and open economies
This export-led model increases geopolitical tension and raises the risk of trade retaliation, particularly at a time when many economies are already sensitive to industrial policy and supply-chain security.
Readers will note this is the environment in which assets such as those owned by BlueScope Steel in the US and Australia become dramatically more valuable. Just this week Prime Minister Albanese discussing anti-dumping measures for steel to protect such assets. In the medium-term these themes will be just as strong in Slovakia and Slovenia in (EU) and Brunei and Laos (ASEAN).
Rising geopolitical tension and aggressive mercantilism aren’t the only story, however.
China retains policy space to cushion against potential adverse shocks. And to assume that China cannot exercise flexibility would be folly.
But for over a decade the idea that rebalancing and structural reforms could facilitate a shift of China’s economy onto a sustainable and strong growth trajectory simply hasn’t happened.
We contend that despite having time on their side for more than a decade, the demographic clock is now rapidly working against China’s capacity to engineering a transition without negative consequences for Australia and other trading partners.
And secondly, the level of savings and investment in the economy, remain too elevated for the pace of debt growth. Put simply, it is fine to borrow money to grow but at some stage you also need to generate income to support the debt, and consumption to utilise the products.
Population growth is now negative for each of the four years since 2022, with falls accelerating.
Figure #2: China’s birth rate falls again – Death rate rises
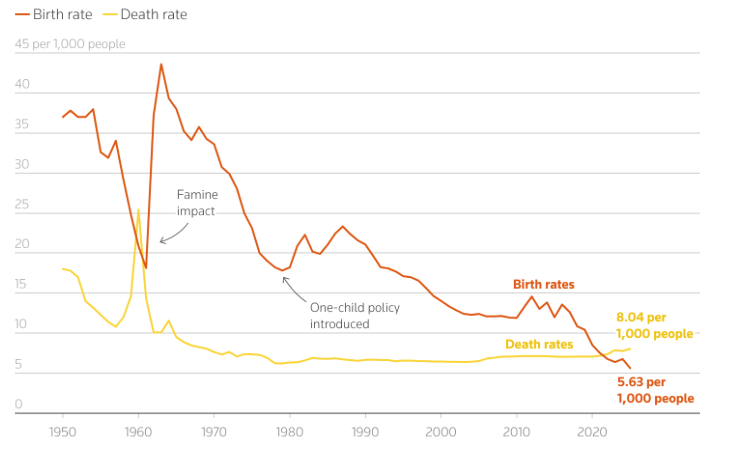
Source: LSEG DataStream, China NBS, Reuters
China’s collapse in births has been both rapid and severe. While cultural shifts, urbanisation, and high education costs are key drivers, the speed of decline raises additional questions.
One possibility is that population levels have been overstated. It has often been contended in recent decades that such overstatement occurred, and if it had, the decline in birth rates post 2015 would provide evidence of such. If past census data over-counted certain cohorts, even if this occurred in the 1960s and 1970 or failed to capture emigration accurately, then:
- The true base for births may be smaller than assumed
- The demographic decline could be sharper than official projections suggest
Even modest overstatement compounds over time, accelerating ageing, shrinking the workforce, and worsening dependency ratios.
When combined with rapid ageing (not as problematic as in the West) this complicates any plan to boost domestic consumption and rein in debt. China is ageing rapidly before reaching high-income status — a historically difficult path.
Declining population limits both incentives to invest, and expected returns
Despite the limitations of the following analogy, especially in a globalised open economy, imagine a regional city, it can be in the Midwest of the US, any state in Australia or part of the UK ex London. Would it be possible for such a city’s economy to be occupied with 40% of its activity building and reinvesting if, not only was its population falling but expected to dramatically reduce in the medium term.
Would investment be twice the rate of investment in Australia if birth rates were the lowest in more than 75 years? No, it wouldn’t. We have all been to cities and regions with falling birth rates and aging population, investment dries up because the returns to investment dry up, no matter what the city’s politicians or resident population desires.
In a market economy, banks hopefully stop lending, and perhaps governments continue to invest for a little longer (Roads to Recovery springs to mind in Australia) but eventually the investment activity in declining regions dries up.
But China is not a market economy; so what if investment continued instead? This continuing investment, fuelled by debt, now produces less growth at the margin. In other words, each unit of growth requires more credit than before. This is a classic sign of declining capital efficiency. This is what is occurring in China, and ultimately raises questions about:
- The true underlying growth rate -remember more investment is more growth, regardless of its quality.
- The sustainability of fiscal and quasi-fiscal support
- The risk that reported GDP overstates genuine economic momentum
The chart below shows the decline in productivity of debt in China. Additional debt isn’t associated with the significant additional activity, a 3 to 4:1 ratio, as was achieved 20 years ago. Today debt isn’t generating excess returns at all.
Figure #3: Debt intensity in China – Units of GDP per $ of additional debt – 5yr avg
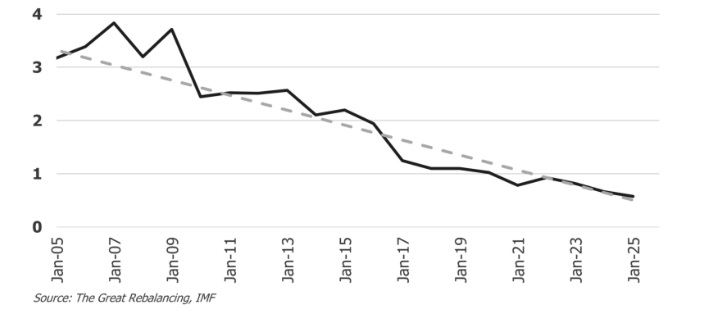
There is however no “critical” level for this measure, your author thought the levels reached in 2017 represented a challenge to the Chinese model of continuing to build versus adapting their economy. The International Monetary Fund had the same view. The returns have continued to worsen.
With capital efficiency of government debt collapsing and other debt expanding rapidly, debt is now rising much faster than GDP, despite deflationary pressure. The following figure shows the rise in total debt by type. Without massive productivity gains appearing from the nonfinancial (NF) corporate sector the pace of debt growth appears problematic.
Both the level and the rate of growth of debt are exceptional for a country at China’s stage of development. China’s private non-financial sector debt to GDP ratio is high relative to other emerging market economies and comparable to levels in many advanced economies. Rapid credit growth has often been a precursor to a financial crisis. Even in countries that have avoided full-blown crisis, post-boom growth tends to suffer from a marked step-down after the end of a credit boom.
Figure #4: China’s debt is rising very fast ($USbn)
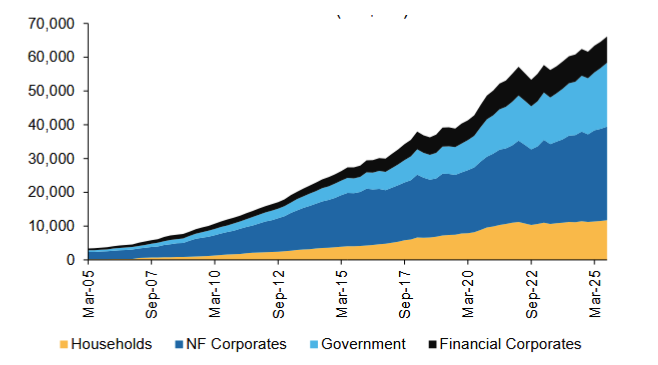
Source: Macquarie Global Strategy, IIF
So if 2017 didn’t represent the nadir of capital efficiency, then who is to say that 2025 is any closer, what is clear however in 2025 is that competitive mercantilism, declining global institutional strength, and rapidly falling population have now joined the chorus.
While China retains policy flexibility, repeated reliance on credit expansion increases the probability of diminishing returns and longer-term stagnation.
Where to from here
At this point your author again reiterates the policy flexibility retained in an autocratic system, especially a surveillance state with control of its own currency and money supply. China isn’t Mexico (1982) or Thailand (1997) or Argentina (2001, 2014, 2020).
Whilst China risks a liquidity trap, where interest rates are too low, savings are too high and marginal monetary policy stimulus becomes ineffective, it can pivot its economic model to a range of alternatives.
What matters?
What matters to our clients is what the impact is on the Australian economy and Australian companies. This is where the rubber hits the road. China has traditionally relied on investment spending to keep its economy humming. But according to the official figures, fixed-asset investment (FAI) shrank in 2025 for the first time since 1989.
Markets have traditionally relied upon FAI growth to understand demand for commodities, especially iron ore, so a contraction in FAI to appears to be downside risk to iron ore demand, especially considering new mines in Africa.
Chinese innovation, and the built-up benefits of a generation of excess investment may indeed provide ongoing productivity growth. And Japan proves that a shrinking population isn’t necessarily incompatible with rising living standards. Japanese GDP growth has been weak but per capita growth has been reasonable.
But productivity needs to rise and institutions need to be strong. The chart below from the Australian Treasury in 2023 shows that indeed Japan in the decade to 2021 had similar productivity growth to New Zealand despite vast differences in population dynamics.
Note that Australia’s productivity lead has all but been obliterated in the 5 years since the comparison.
Figure #5: International productivity growth – 10 years to 2021
So we return to the core question. Does China return to its old model one more time: stimulus, investment, excess capacity and more debt, higher demand for resources, and the magic number for GDP growth is reached again. Perhaps, and arguably the price of BHP and RIO assumes such an outcome, but what is that era has passed?
Our portfolio seeks to balance these risks by choosing those materials with strong ex-China growth, we invest in international equities markets but avoid exposure to China. This is not because the model is broken today, but because it is in no-one’s interest, especially the Chinese to continue this model forever.
Portfolio news
Origin Energy – Kraken Technologies
Origin Energy has remained a successful core holding in clients’ Australian equity sub-portfolios for many years. Its role in Australia’s energy transition is incomparable, with a large customer base and a range of assets across the value chain, including gas, generation, renewables, storage, and virtual networks.
In addition, Origin has benefited from an obscure investment in Octopus Energy, which has become a core asset, now accounting for 20% of Origin’s enterprise value.
Origin Energy first invested in Octopus Energy in 2020, acquiring a 20% stake as part of a strategic partnership to accelerate Origin’s digital retail capabilities and gain exposure to next-generation energy platforms. The business is based in the United Kingdom and has since grown worldwide. The investment reflected a view that the future of energy retail would be shaped less by commodity supply and more by software, data, and customer-centric operating models. Since that initial investment, Octopus has grown rapidly in customer numbers and international reach, validating the strategic logic behind Origin’s early involvement.
The January 2026 corporate restructure at Octopus marks an important evolution in that journey. The group has separated its fast-growing Kraken technology platform from its regulated and capital-intensive retail and generation businesses, allowing each to be managed, funded, and valued independently. Effectively the Kraken Technologies business and the Octopus Energy business has been split, and could be on-sold separately.
Kraken provides cloud-based billing, customer management, real-time pricing, and grid-optimisation software that enable utilities to operate more efficiently and integrate renewable energy at scale. The $1bn capital raise completed at the same time as the restructuring valued the business at approximately US$8.65bn on a standalone basis. Origin retains 22.7% ownership of the Kraken business.
Kraken’s enterprise software platform has a strong track record of large, fast customer migrations, which are critical for deployment and growth. This success is evident in the dramatic growth of Kraken’s global customer base, as shown in the figure below. “Contracted” refers to the size of potential customers who have signed up for the Kraken product, and “Live” refers to accounts that are fully migrated.
Figure #6: Kraken customer growth has been extraordinary
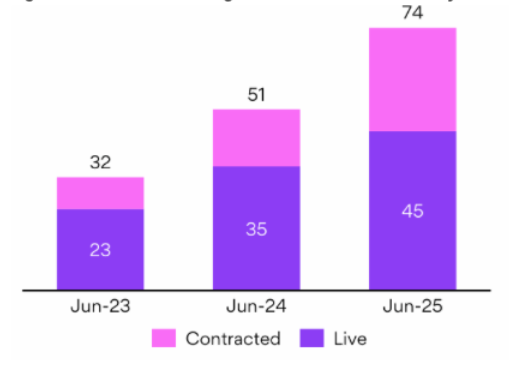
Source: Kraken
Origin and Kraken estimate the global addressable market at 2.1 billion households, so the capacity to grow with an industry-leading solution remains vast.
The restructure improves transparency around profitability and capital intensity, enabling investors to clearly distinguish between infrastructure-like energy assets and a capital-light, high-margin technology platform. For Origin, the separation sharpens visibility on where value is being created and reinforces the original investment thesis that Octopus is not merely an energy retailer, but a scalable global energy-technology business.
We value Origin’s stake (22.7%) in the Kraken and Octopus assets at approximately $3 per Origin share post-restructure, representing a substantial and highly attractive uplift in value since the initial investment.
Eraring extension
Also making news at Origin was the announcement that the Eraring coal-fired power station will now operate until 2029, having previously been scheduled for closure in August 2027. The revised timing is was largely in line with stock market expectations. Within the electricity market,there was a broad understanding that the system was not ready for Eraring to exit.
For Origin, the impact of the extension is positive; its stable of generation assets puts it in a strong trading position to capitalise on the uncertainty of available output. Not all assets in the electricity system are equal; some create substantial value in certain conditions. Without getting into the weeds of synchronous vs nonsynchronous production, the key to value-creation is Origins’ flexible fleet which is further strengthened by Eraring, especially when Eraring has also completed its on-site battery investment.
Our position
Recent market weakness in global software share prices, and softer short-term electricity pricing is providing an opportunity to add to our position in Origin in the mid $11 range.
Aurelia Metals
Aurelia Metals released its quarterly operations report on Wednesday. We shared the market’s appreciation for the result, which saw the stock rise 9% on the day. The share price is up 26% in January, with global conditions supporting base metal producers like Aurelia, especially those with gold production.
The positive vibe from this update built upon other strong quarterly results since August 2025. The company is achieving a strong balance between cash flow sustainability and growth. Disciplined execution and sensible capital allocation have driven rising equity value.
The company highlighted that it remains operating cash flow positive, supported by stable production from its Cobar, NSW, operations despite ongoing cost pressures from labour, energy, and underground development.
We were especially pleased that quarterly production skewed towards maximising gold. Aurelia is now on target to produce volumes at the top end of its guidance range of 35-45koz. Higher gold grades and improved recoveries have supported cash generation and enhanced free cash flow resilience.
The balance sheet is now in great shape.
Exploration and development
The long-term highlights of the quarterly report were centred on medium-term sources of value – development capex and exploration. Following a disappointing downgrade of production expectations across the life of mine at Federation in 2025, recent performance remains ahead of the revised plan, and consistent with the Federation asset generating substantial value. Given the funding of this asset was provided by inexpensive equity raise in 2023 (9c per share) the total returns are beginning to look good.
Figure #7: Federation Mine: Ramp up ahead of new plan
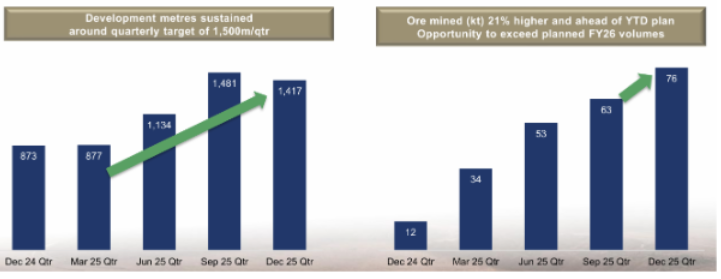
Source: Company reports January 2026
We were also pleased by progress on one of our favourite development projects, Great Cobar, and ongoing feasibility work surrounding options at Nymagee.
Exploration also formed part of the update, albeit with a disciplined focus. Spend is being directed toward near-mine exploration and resource conversion, targeting incremental mine-life extensions rather than higher-risk greenfield programs. Overall great result for a long-term position.
The information in this article is of a general nature and does not take into consideration your personal objectives, financial situation or needs. Before acting on any of this information, you should consider whether it is appropriate for your personal circumstances and seek personal financial advice.