
Copyright 2026 First Samuel Limited
Read the previous Investment Matters here.
In this week’s Investment Matters, we highlight a range of reporting season results and provide some commentary from meetings with management. The 2nd week of reporting is usually the busiest, and by the weekend, more than 75% of the portfolio by value had reported.
Across the market, whilst overall index levels are higher since the start of the month, most companies’ share prices are lower. In fact, the entire ASX300, excluding the largest 20 companies, is down more than 1 per cent for the month, with smaller companies underperforming.
The divergence between the top 20 and the rest is predominantly driven by the extraordinary rise in the prices of the Big 4 banks. In a period of higher uncertainty, amid deep questions about the sustainability of technology and software earnings, the market reflex has been to run towards the most expensive remaining parts of the market, predominantly the largest financial stocks, especially CBA. But with bank dividends materially lower than bank deposit rates, forward price-to-earnings ratios at or near record levels, and a compromised growth outlook due to challenging housing affordability, we continued to avoid them.
Over the remainder of February, most companies will report to the market. Investment Matters will present our weekly results snapshot in the following table format. What company reported, the period for which the results are reflected, our view on the results, and the change in share price from the time of the result to the time of publishing.
The large number of companies reporting this week has meant the table is extensive and necessarily brief. In time, we will provide more detailed information, primarily on how the results changed, reinforced, or underminedour investment thesis. We will also include graphs and charts from the presentations that clearly capture the key trends that impact the long term.
This week’s in-depth discussions include Reliance Worldwide, BlueScope Steel, Seek Limited, and Origin Energy. We will return to other important positions, including Healius, Emeco and Challenger in the coming weeks.
The Market
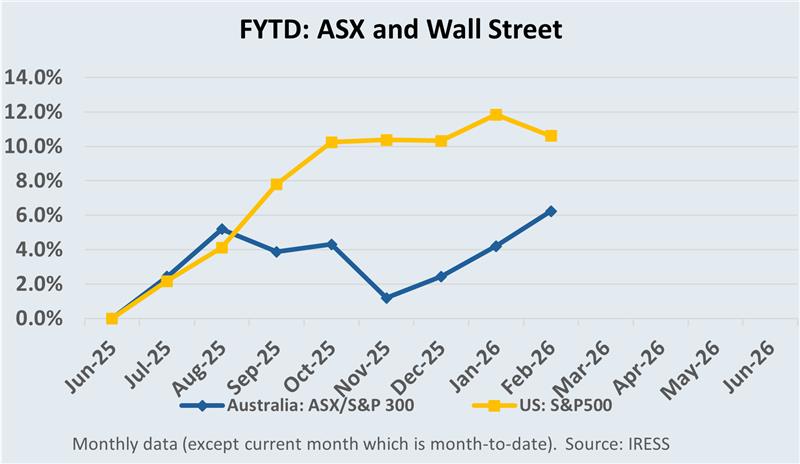
Table 1:
Week 2 Company reporting season – Portfolio results*** Part 1
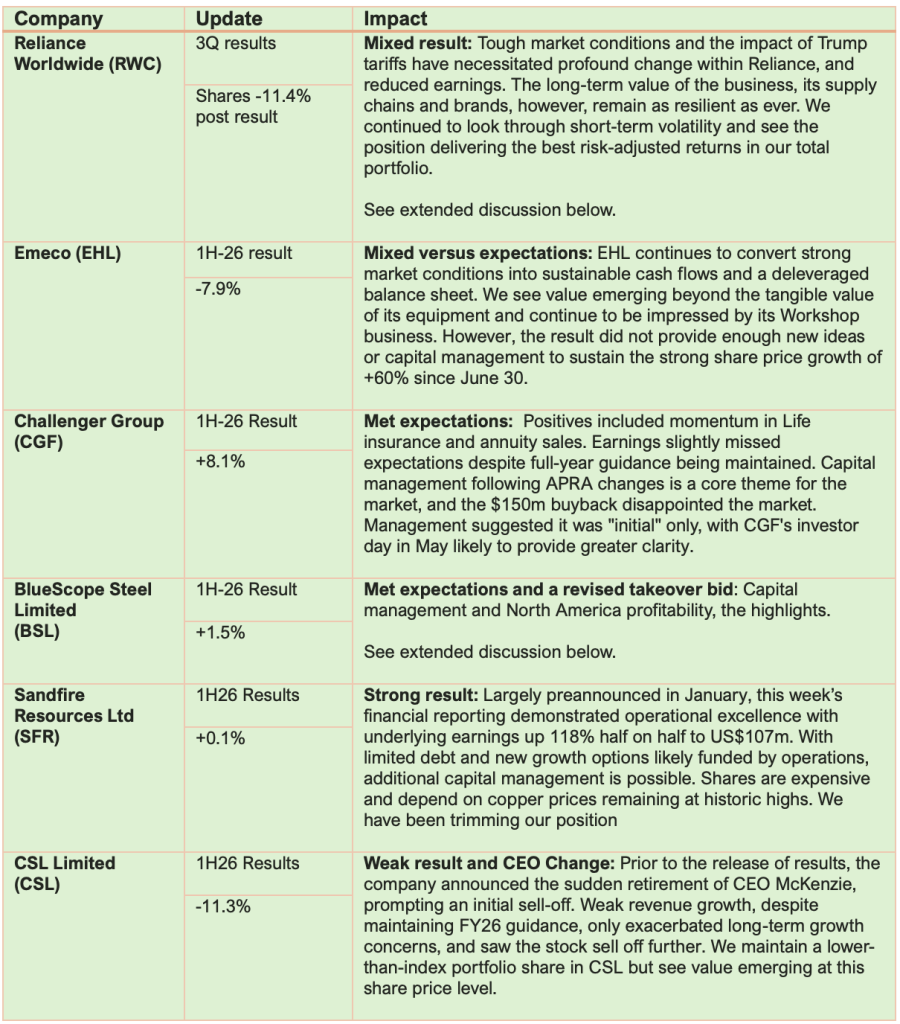
Table 2:
Week 2 Company reporting season – Portfolio results*** Part 2
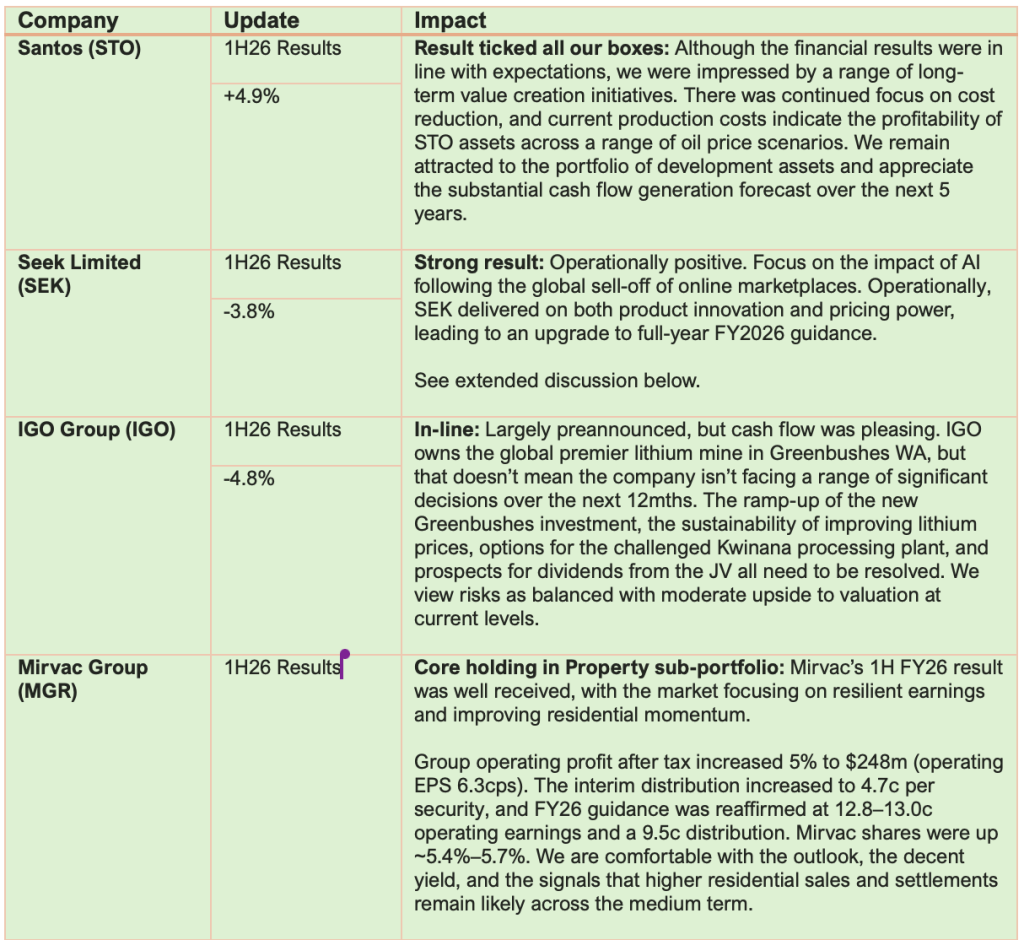
*** Price change is the percentage change in price from the day prior to the result to the market close on 19th February
Source: First Samuel
BlueScope Steel
Improved conditions and change of focus. Takeover bid should proceed regardless.
BlueScope’s 1H FY26 result was notably stronger, driven by the US business. Reported NPAT rose to $391m (up 118% vs 1H FY25) and underlying EBIT was $558m, reflecting stronger US steel spreads, higher volumes across key markets and solid cost performance despite “sustained low” Asian spreads. The improving conditions that have led to higher profits were expected by all and were core to the investment thesis.
But only in response to takeover interest has the company pursued other changes related to gearing and capital management.
On the takeover front, BlueScope disclosed a revised (2nd) unsolicited, non-binding and conditional proposal from SGH and Steel Dynamics at $32.35 cash per share, described by the bidders as “best and final”. The structure would see SGH buy BlueScope, then on-sell the North American businesses to Steel Dynamics. The board is evaluating the proposal versus fundamental value and executability, noting it unanimously rejected the prior consortium offer as “very significantly” undervaluing the company.
The message is clear: the board is leaning into cash returns and valuation support at exactly the moment the company is under external pressure. However, its opportunity to run the business better is long past.
Our concern at this stage is that the deal doesn’t proceed. We would appreciate the excellent SGH management team operating the Australian assets. We would also welcome the opportunity to invest in Steel Dynamics separately at a reasonable price in the future. Remaining listed and combined in the face of such an offer would be a 3rd best solution.
Back to the result
BlueScope Steel is promising to shower shareholders with significantly higher dividends after more than doubling its interim profit. Capital management was a key message: BlueScope reiterated plans to deliver $3.00 per share of total shareholder returns in calendar 2026, including the previously announced $1.00 special dividend, and flagged an expanded buyback capacity (up to $310m over 12 months).
The company guided 2H FY26 underlying EBIT of $620m–$700m, with stronger US conditions expected to more than offset softer Asia and FX headwinds. For 1H FY26, BlueScope reported NPAT of $391m (up 118% on 1H FY25) and underlying EBIT of $558m, driven primarily by a strong performance in the US. Improved spreads and solid utilisation in North America more than offset softer conditions in parts of Asia and a more mixed Australian backdrop.
By segment, North America was the standout with underlying EBIT of $447m (up 35% vs 2H FY25), helped by North Star running at 100% utilisation, stronger realised spreads and a production record.
Figure #1: BlueScope Steel US Division – earnings (EBIT) and sales (k tonnes) trajectory
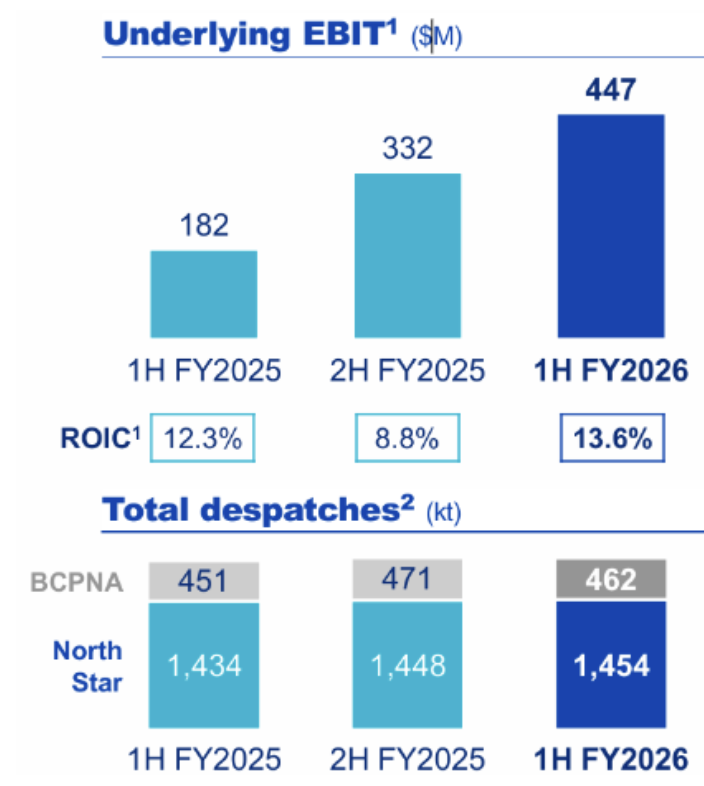
Source: BSL1HFY26 Result Presentation
The figure above highlights the positive trajectory experienced in the US, especially at the North Star mill. We feel that Steel Dynamics, especially in the revised bid structure, is paying a fair price for the underlying assets, and gives BlueScope shareholders due consideration for the synergies and value that Steel Dynamics will unlock in the future.
Our only regret, should the sale proceed, would be missing out on some value in the US Building Coated Products (BCP) division, whose performance improved in the half as turnaround efforts continued. Part of the weakness of existing management was its inability to see the value in turning this business around. Despite its remaining loss-making, BCP remains a key platform for growth in North America, and the strategic rationale will be a gift that suitor Steel Dynamics will exploit with more gusto and support by frankly more management ability.
Australian Steel Products delivered $122m EBIT, with softer pricing/spreads offset partly by robust COLORBOND® volumes, while the company continued simplifying the portfolio (including selling its 50% Tata BlueScope JV stake) and progressing major capex projects (Port Kembla upgrades, Western Sydney coating line, North Star debottlenecking).
Figure #2: BlueScope Steel Australian Division – earnings (EBIT) and sales (k tonnes) trajectory
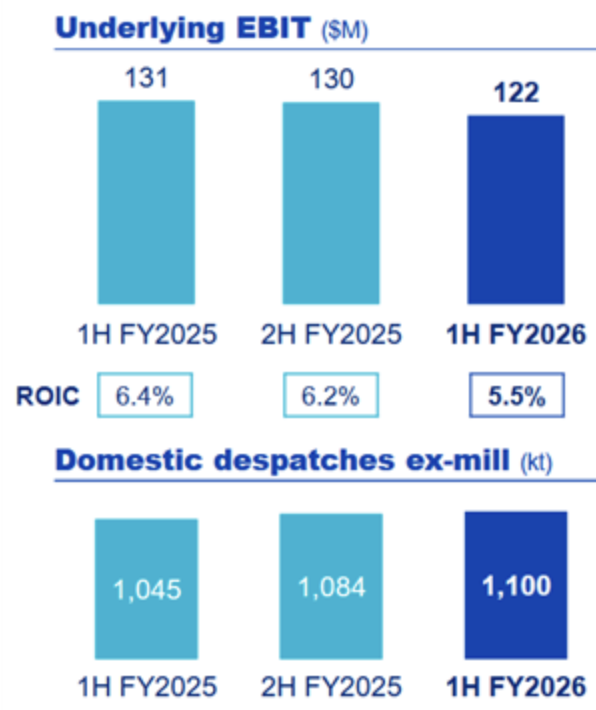
Source: BSL1HFY26 Result Presentation
With increasing political support for domestic industry emerging from all sides of government, we are excited about the value the SGH and the Stokes’ management team will unlock in the Australian businesses in the coming years. The key element of the figure above is the ROIC (return on invested capital), which remains low. The SGH way of doing business will concentrate on improving ROIC, and recent experience suggests they may succeed.
Alongside the distribution uplift sits a renewed internal efficiency agenda. BlueScope is targeting $150m in total cost savings under a “Simpler, Leaner, More Agile” program, with initiatives in place by 30 June 2026 and the full run rate delivered in FY2027. The focus areas are streamlining leadership and functional teams (reviewing personnel and external spend across functions, with leadership reshaping already underway) and rationalising core processes (consolidating common enterprise services across the business).
The nature of the proposed changes only strengthens our view that if it takes a takeover bid to focus the mind, then perhaps such changes can be completed by an entirely new organisation just as well.
Reliance Worldwide: Copper pivot
Reliance Worldwide (RWC) delivered a soft 1H FY26 result, with earnings pressured by tariffs and weaker end-market demand in both the US and UK, but management emphasised strong cash conversion and active self-help to rebuild margins.
The market expected earnings weakness, yet a combination of extended tariff-related costs and weakness in specific product margins in Australia led to further downgrades of FY26 earnings expectations of 2-5%. The market responded aggressively, selling the stock by more than 10 per cent.
Over the past 12 months, post “Liberation Day” and the introduction of tariffs, these policy shocks, combined with soft conditions across many of Reliance’s markets, have clearly placed pressure on the company. Yet RWC has responded remarkably well, and in our view, the business is stronger today than it was in April 2025. Supply chains are more flexible and sustainable; see the figure below, which highlights the reduction in China-sourced goods. Product innovation is accelerating, cost-out programs are intensifying, and the value of further acquisitions is clearer.
Figure #3: Sell help and strategic change. Expected reduction in China-sourced goods $USm
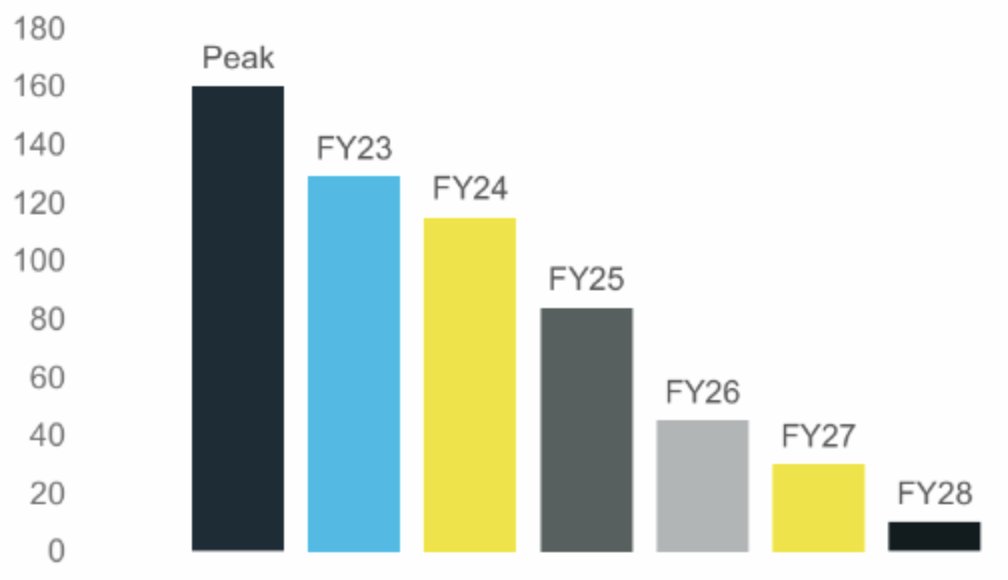
Source: RWC1HFY26 Result Presentation
For this reason, and despite the short-term market reaction, we are more comfortable with the medium-term value in this core holding
Back to the result
Net sales fell 4.6% to US$645.4m, while NPAT declined 34.9% to US$43.7m. On an underlying basis, Adjusted NPAT was US$52.2m (-31.3%) and Adjusted EBITDA was US$111.4m (-22.5%), implying an Adjusted EBITDA margin of 17.3%.
The company highlighted that headline sales were flattered last year by a pull-forward of demand in the Americas, and this half was also affected by the exit of low-margin Canadian product lines and the sale of Spanish manufacturing; after adjusting for these, underlying net sales were down 1.9%.
On outlook, RWC expects 2H FY26 conditions to be broadly consistent with 1H, but with tariff mitigation (sourcing shifts, selective price actions, and cost-out) improving the margin trajectory. The company reiterated the FY26 net tariff impact of US$25–30m, weighted to 1H, and guided to mid-single-digit 2H sales growth (adjusted for Canada/Spain changes), with full-year sales broadly flat and FY26 margins below FY25.
Despite lower earnings, RWC’s cash generation remained a clear positive. Cash generated from operations was US$102.6m, and operating cash conversion was 92.1% of Adjusted EBITDA, supporting a further US$21.2m reduction in net debt and maintaining a strong balance sheet.
The figure below shows Barrenjoey Research’s estimates of gearing from 2022 through to the 2027 forecast. We share their view. Net debt is presented as a multiple of operating cash flows (Net Debt / EBITDA). We believe that RWC can have debt levels at circa 2.5x EBITDA, at the top end of the Target Range. Given that leverage is expected to fall below 1x in FY27, the company has a large war chest for future acquisitions.
Figure #4: RWC has a very strong balance sheet – supporting future acquisitions
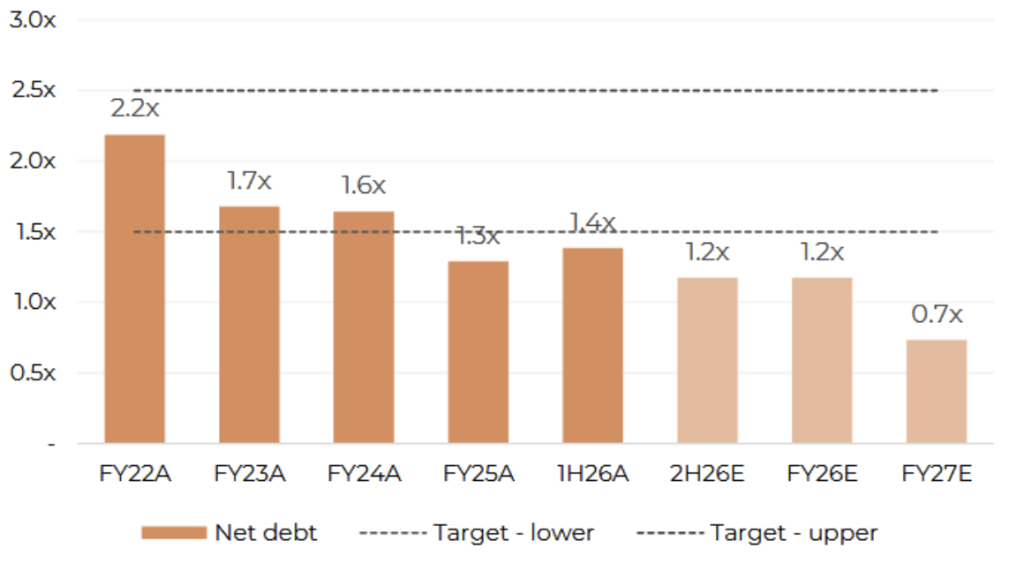
Source: Company data, Barrenjoey Research
Capital management was steady: RWC declared a total distribution of US 4.0 cents per share, comprising an unfranked interim dividend of US 2.0 cents per share plus an on-market buyback of US 2.0 cents per share(US$15.3m).
Strategic pivot away from copper!
A strategically important overlay is RWC’s push to reduce copper exposure by substituting materials in key brass-heavy product categories. Management set a clear internal target: by FY29, copper is intended to be “no longer a material part” of the RWC P&L, implying both design-led material substitution and a manufacturing footprint that supports alternative processes. The company linked this effort to longer-term competitiveness, pointing to prior investments in automation and assembly flexibility, as well as newer capacity plans (including Poland and Mexico) that can support the transition.
Following our meeting with management later in the week, we were impressed by the strategic value RWC can unlock by building capacity and product pathways outside of copper. Greater use of stainless steel in selected products will be welcomed by RWC customers. The pivot also reinforces the company’s lead in innovation and product support for major retailers. Reducing the impact of significant change in copper prices on the final goods will also improve pricing resilience.
While we do not expect copper to remain at elevated levels forever, CEO Heath Sharp noted the company needs genuine materials flexibility should sustained high copper prices pressure demand and encourage customers to trade down to cheaper alternatives in the medium term. We came away encouraged by the depth of management’s thinking here and the optionality these plans provide as both input costs and customer preferences evolved.
Seek Limited
1H26 Result: Discussing the impacts of AI
This week SEEK delivered a strong 1H FY26 operating result despite a large non-cash impairment: sales revenue rose 21% to $646.6m, net revenue increased 12% to $600.9m, EBITDA grew 19% to $267.1m, and Adjusted Profit lifted 35% to $104.1m, supported by a 17% paid job ad yield increase and operating leverage. The board declared a record fully franked interim dividend of 27cps (record date 18 Mar 2026, payable 1 Apr 2026), while statutory results were dragged down by a $356m impairment against Zhaopin.
But the biggest topic for SEEK wasn’t the financial results, but rather what the business looks like going forward in an era when AI poses a threat to it.
Software, classifieds, and marketplace stocks have sold off as investors price the risk that AI assistants and eventually “agent-to-agent” workflows can bypass the tollbooth and cannibalise the economics of great marketplace businesses. In barely six months, AI has swung in the market narrative from an almost universal productivity upside to a potential existential threat. As usual, the truth is mixed: some models look genuinely vulnerable, while others which we think includes SEEK are likely to benefit as AI makes high-quality matching, trust and workflow efficiency even more valuable.
The figure below shows the sharp selloff in the US of all companies in the Expanded Tech-Software Sector. The index has fallen 30 per cent since late October. Seek’s share price has fallen 40 per cent since the same date.
Figure #5: US IGV Software Tech Sector
Source: Google.com
All eyes and ears were on the management team’s reaction to the possibly existential questions. Across the results presentation and various meetings with management this week, a relatively clear position was enunciated to the market.
Management’s AI thesis was not “we also have a chatbot.” It was that AI raises the value of the incumbent marketplace when the incumbent owns (1) dense outcome data, (2) trust and brand, and (3) the operating capability to continuously improve the product. SEEK is effectively arguing that the interface layer may change; more conversational, more automated, more proactive but the hard part in hiring remains delivering outcomes at scale, with low friction, and with safety and trust. This is why they spent time reframing AI as a force that can strengthen the leader rather than automatically disintermediate it.
The perspective that resonated the most with your author was:
…. the “scale” moat SEEK describes is not a generic traffic scale; it is scale of hiring outcomes. Candidates want confidence that they can see all relevant opportunities; hirers want confidence they can access all relevant candidates. Missing the right job or the right candidate is not a small inconvenience it can be economically consequential and that reality pulls both sides toward the venue most likely to be complete.
SEEK’s own placement share disclosure (survey-based) is a useful anchor: the task for any would-be disruptor is not to build a clever agent, but to replicate a very large share of real-world placements. Even if AI can quickly improve the theory of matching, it still has to shift a substantial share of outcomes before behaviour changes at scale.
This is also why SEEK leans so hard on proprietary data and feedback loops. Management pointed to the scale of their marketplace signals hundreds of millions of data points per day across their footprint and argued that the majority of those signals are not accessible to third-party tools operating outside the marketplace.
Their claim is that algorithms powered by LLMs (large language models) can translate those signals into better matching, better ranking, and proactive recommendations, ultimately leading to improved outcomes and stronger monetisation. In their framing, AI is not replacing the marketplace; it is upgrading the marketplace’s ability to convert intention into successful hires. Time will tell.

The pricing power question is central: if AI agents can “do hiring for free,” can SEEK keep charging? The most practical counterpoint is that free alternatives have always existed in some form professional networks, internal databases, aggregators, social channels, and increasingly DIY AI tools yet SEEK argues it has continued to get paid because it delivers demonstrable value in a high-stakes event. SEEK’s view is that if AI truly could deliver those outcomes for free, pricing power would be at risk but their recent ability to grow yield in a world with free options such as LinkedIn and Indeed is offered as evidence that buyers pay for outcomes, not novelty.
There is also an underappreciated economic angle: “free AI” today implicitly assumes that compute subsidies will continue indefinitely. At small scale, this can look plausible. At true marketplace scale, it becomes far less so. If we move to millions of candidate-side agents continuously interacting with millions of hirer-side agents, the compute intensity is substantial. Those costs do not disappear; they must be borne somewhere in the value chain. In that world, marketplaces that can reduce noise, verify identity, screen quality, manage workflow, and measure outcomes may have more reason to exist and a stronger basis for pricing resilience, not less. Paradoxically, if AI increases application volume and low-quality matching (“noise”), it can increase the value of trusted marketplaces that can filter, rank and convert. We appreciate this argument.
Earnings impact? Management’s position is that AI will help incumbents do more for fewer dollars, but the path from productivity to reported profit is not linear. AI investment sits across both capital expenditure (capex) and operating expenditure (opex): it may be weighted to capex, but higher development intensity and IT tooling still lift opex.
This is why we think it is more sensible to judge progress on a total cost basis rather than cherry-picking one line item. The near-term benefit is therefore less likely to show up as a headline “cost-out” and more likely to appear first as individual productivity and product velocity.
But these were our long-term concerns regarding SEEK’s inflated cost model, which is now facing further threats. SEEK has not always demonstrated the level of cost control that a high-margin marketplace should be able to achieve. Part of our thesis is that the costs can be reduced materially. AI can deliver real productivity gains, but management can still squander them. If SEEK treats AI primarily as justification to run more projects, add more complexity and keep the cost base rising, it risks wasting the earnings dividend that AI should deliver.
In our view, a key marker over the next 12–24 months will be whether SEEK can show genuine operating leverage not just in a single half, but consistently while still improving the product. The opportunity is real; the discipline will determine how much of it accrues to shareholders.
Finally, on “AI-native” challengers, SEEK’s rebuttal is pragmatic. Yes, you can spin up an agent quickly and cheaply but without the marketplace context, it “won’t do anything” economically meaningful. Lower unit costs to build a feature do not automatically translate into greater customer value. SEEK is not competing on the cost to launch a website; it is competing on two-sided liquidity, trust and outcome delivery.
Net net, we think the market’s AI fears are directionally understandable but overly blunt. Some models will be disintermediated. Others especially those with deep outcome data, trusted brands, and genuine marketplace liquidity can use AI to improve matches, boost conversion, and strengthen pricing resilience. SEEK fits that latter profile, provided it pairs the strategic opportunity with sharper cost discipline so that AI’s productivity gains translate into shareholder returns rather than simply a larger cost base.
Origin Energy
1H26 Result – Battery-assisted structural growth
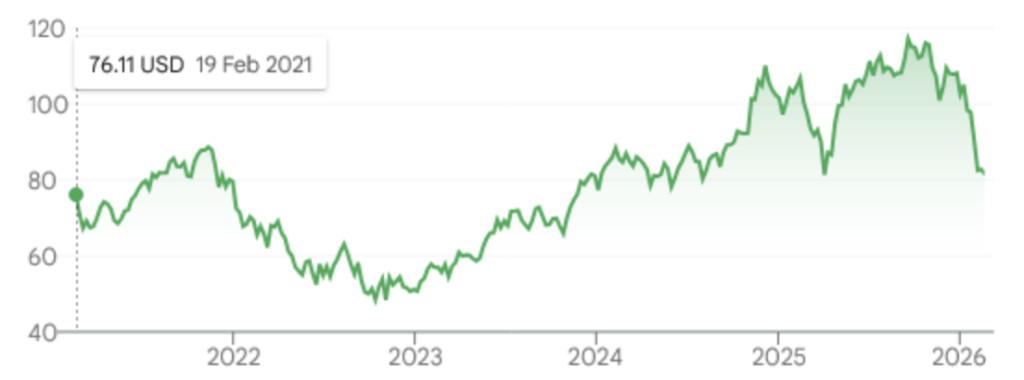
Origin Energy’s 1H26 result was presented last week on the 12th February. The share price has risen by 9.7 per cent since then.
The result, and the accompanying presentation, are among the clearest “core holding” confirmations we have seen in some time. The share price reaction reflected that confidence: reports noted the stock jumped ~8% intraday on the day of the result (its biggest move in years) as the market digested upgraded Energy Markets guidance and evidence of structurally stronger electricity margins.
At the headline level, Origin delivered statutory profit of $557m and underlying profit of $593m, while holding the fully franked interim dividend at 30c per share. Dividend stability matters: it signals confidence that the uplift in electricity profitability is not a one-off and that the balance sheet can support both investment and shareholder returns through the next phase of the transition.
Figure #6: Origin Energy Result Snapshot: Note Free Cash Flow up $187m
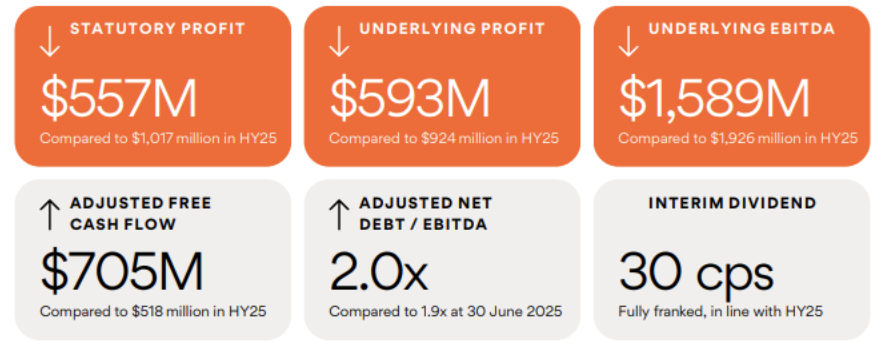
Source: 1H26 ORG Result Presentation
We met with management later in the week, including CFO Tony Lucas, and the structural strength of the result was the standout. In Energy Markets, Origin’s operational execution, short-generation and customer engine continue to differentiate. The company added ~96,000 customer accounts in the half, alongside improvements in customer metrics and service delivery. Importantly, this is being achieved with a “brilliant process” backbone supported by Kraken, which has evolved from a technology enabler into a strategic asset embedded in the company’s competitive advantage. Origin’s leading customer experience and automation sustain value creation across the entire energy market. The operational execution is central to sustaining market share, reducing churn, and improving gross margin outcomes across a large and complex customer base.
Energy Markets is also where the result’s operating leverage is most visible. Origin disclosed that electricity gross profit increased by $102m to $840m, reflecting the lagged benefit of higher wholesale costs flowing into retail pricing and disciplined portfolio settings. Underpinning this, Origin upgraded its outlook for Energy Markets, now expecting full-year earnings of $1.55–$1.75bn for the division, after delivering $860m in the half. That guidance upgrade is a powerful statement: it suggests the business is not merely riding a temporary spike but is capturing a more durable margin set in a market grappling with tight supply, delayed renewables rollout and higher volatility.
A second structural lever is Origin’s unrivalled position in energy markets distribution. The combination of the large-scale Earring coal-fired power station with the “peak” operating gas plants, a huge network of sustainable (sun & wind) sources, and its own VPP (Virtual Power Plant) provides a scale advantage that becomes more valuable as the system becomes more complex.
Origin has the ability to integrate retail pricing, hedging, generation and storage decisions in a way that smaller competitors struggle to replicate. And this is where innovation is beginning to translate into sustainable increases in electricity gross margins. The company’s battery strategy anchored by the Eraring battery build-out and a broader multi-gigawatt pipeline is designed to monetise intraday volatility while supporting reliability as coal exits. Crucially, extending Eraring’s coal plant life to 2029 provides a longer runway for system tightness and stability, improving the economics of Origin’s integrated portfolio as batteries scale.
Our favourite chart of the reporting season so far is the following. It shows how Origin uses its battery capacity throughout the day. Yellow is the charging period, which corresponds to the low Prices (RHS). The purple area is when the batteries are discharging. These periods correspond to the evening peak price and usage periods. The price difference between the two periods is pure gross profit. Charge when electricity is cheap, discharge that is provide to the grid when it is expensive.
Figure #7: Intraday usage of battery – Origin Analyst Information
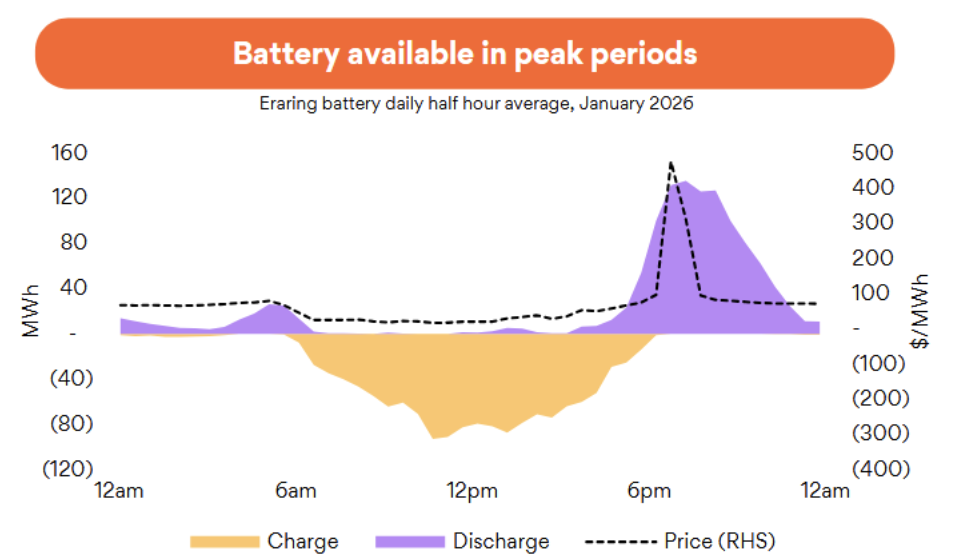
Source: 1H26 ORG Result Presentation
On Integrated Gas, the half was more mixed, with earnings down as commodity prices and production outcomes normalised. Reuters noted Integrated Gas earnings fell ~31% in the period. That said, we view APLNG as “adequate” this half, not the hero, but still a meaningful contributor and we agree with management’s framing that Integrated Gas can deliver higher earnings in future years as volumes, pricing and project timing evolve. The key point is that Origin does not need heroics from APLNG to support the equity story; the Energy Markets engine is now sufficiently strong to carry the investment case even through softer gas cycles.
Analyst commentary through the week largely echoed this interpretation: brokers and market writers highlighted the electricity beat, the upgraded Energy Markets guidance and a constructive outlook.
Stepping back, Origin looks increasingly well placed for the energy transition. The company is assembling an unusually resilient mix: a leading retail and customer platform (increasingly Kraken-enabled), an electricity portfolio positioned to benefit from volatility and tight supply, a storage build-out that should compound returns as renewables penetration rises, and an Integrated Gas business that provides optionality and cash flow diversification. In our view, this week’s result and presentation were not just “good numbers”; they reinforced a structural thesis. For a core holding, that is exactly what we want to see.
The information in this article is of a general nature and does not take into consideration your personal objectives, financial situation or needs. Before acting on any of this information, you should consider whether it is appropriate for your personal circumstances and seek personal financial advice.